


 Login
 Blog
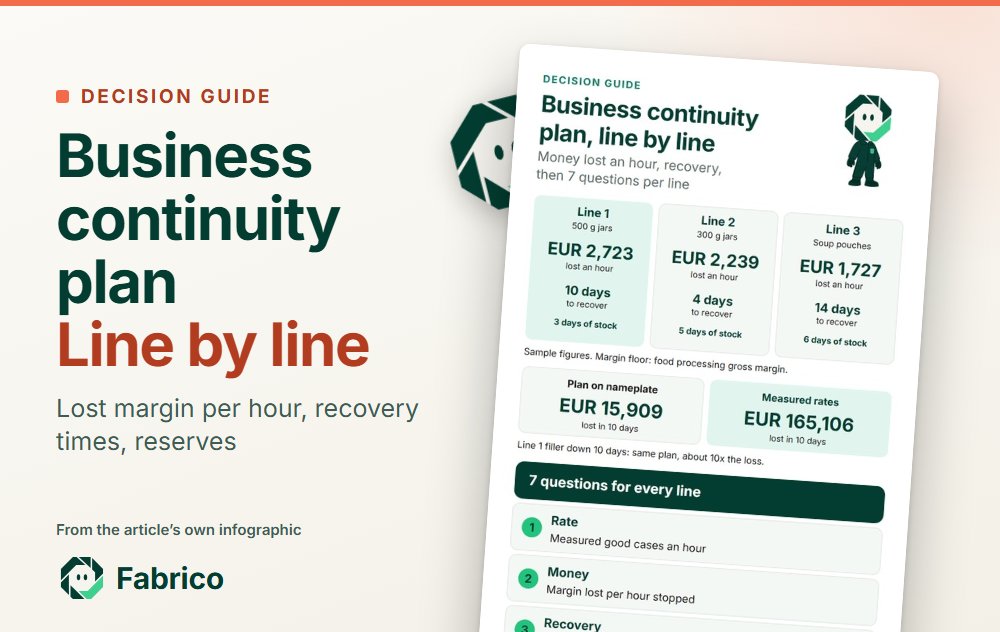
Business Continuity Plan for Manufacturing: Line Impact and Reserves

In short: a business continuity plan for manufacturing starts with a business impact analysis done line by line: what each line earns per hour, how long its worst credible failure takes to recover, and what you hold in reserve to cover the gap. Build it on measured rates, because a plan built on nameplate speeds overstates how fast you recover.
- Per line: lost margin per hour, recovery time, stock cover, alternate capacity, single-source inputs.
- In the worked example, nameplate rates put a 10-day filler outage at EUR 15,909; measured rates put it at EUR 165,106.
- Reserves differ per line: a critical spare, more stock, an alternate line, a co-packer, insurance or a second supplier.
- Test the plan yearly and refresh the rates from line data, not from the machine plate.
A continuity template written for offices and IT asks about backups, remote work and call trees. A plant manager needs something else: how many cases each line ships per hour, what happens to orders when the filler on that line breaks, and which reserve covers the gap at a price the business accepts.
This guide covers the production side of the plan. It works through a business impact analysis for each line, shows why the rates in that analysis must come from line data, runs a three-line food plant through a 10-day filler outage with the money carried through, and closes with a decision block for the reserves.
What a business continuity plan for manufacturing has to answer
The reference standard is ISO 22301. BSI, which publishes the British edition, describes ISO 22301 as the international standard for business continuity: it specifies the requirements for a management system that protects the organisation, keeps critical functions running in a crisis and improves recovery time. It is a management system standard, so it tells you what to have in place, not how fast a filler can be rebuilt. The production answers are yours to supply.
For a plant, those answers fit in four questions:
- Which lines, if stopped, hurt the business most per hour, and why?
- For each of those lines, how long does recovery really take from the worst credible failure?
- How long will customers wait before they delist a product, fine you or switch supplier?
- What reserve closes the gap between recovery time and customer patience, and what does holding it cost a year?
Everything else in the plan (contacts, roles, communication, IT recovery) supports those four. A plan that answers them with numbers is one the finance director can approve and the night shift can follow.
What disrupts production, and how often it costs real money
Risk managers still rank this near the top. In the Allianz Risk Barometer 2026, a survey of 3,338 risk management experts in 97 countries and territories, 29% of respondents ranked business interruption, including supply chain disruption, as a top risk, placing it third. Asked how resilient their supply chains are to geopolitical conflict, shifting trade or critical infrastructure failure, only 3% of the 970 who answered said very resilient.
Claims data shows where the money goes. Allianz Commercial's business interruption claims report (October 2026) analysed 7,888 insurance industry claims worth about EUR 6.74bn from January 2021 to December 2025. The average business interruption claim now exceeds EUR 850,000, around 70% higher than the average property damage claim of close to EUR 500,000. Fire and explosion caused over 40% of the value, natural catastrophes 34%, and machinery breakdown 6% of the value and 6% of the number of claims. The report also notes that tangible improvements such as better fire protection or larger inventory buffers have been limited and uneven since the pandemic, even where firms invested in dual sourcing.
Natural hazards add to that. Munich Re put 2025 natural disaster losses at about US$ 224bn worldwide, of which insurers covered around US$ 108bn. In Europe, losses came to about US$ 11bn, around half of it insured. So in Europe about half of the damage stayed with the firms and households hit, not with insurers.
Utilities matter too. The UK government's National Risk Register 2025, written for businesses among other users, sets out a reasonable worst case for a nationwide loss of power in which full restoration could take up to 7 days. For a regional loss of piped water, alternative supply is to come within 24 hours but is prioritised to vulnerable consumers such as care homes and prisons. A food plant that needs water to clean and to make product should not count on being at the front of that queue.
The pattern for a plant manager: most of the money is lost in the time the business cannot ship, not in the repair. That time is what the business impact analysis measures. Related pages cover two neighbouring questions: supply chain resilience in manufacturing on the supplier side, and heatwave preparedness for one specific hazard.
Step one: the business impact analysis, one line at a time
The business impact analysis (BIA) is the core of the plan. In an office it is done per process; in a plant the natural unit is the line, because a line is what ships product. For each line, collect seven facts:
- Rate: Measured good cases an hour over the last 8 weeks, not nameplate.
- Money: Margin a case, and so the money lost per hour the line cannot ship.
- Recovery: The worst credible failure, and the days it takes to make saleable product again.
- Tolerance: How many days customers wait before they delist, fine or switch.
- Cover: Days of finished stock that can ship, inside shelf life.
- Alternate: Which line or site can run these products, at what measured rate, after which changeover.
- Inputs: Single-source ingredients, packaging, utilities and skills the line cannot run without.
Two of these need care. Money per hour is the margin lost on what the line would have shipped, not the revenue. A sourced floor for food plants is the gross margin in the NYU Stern margin dataset by industry (Aswath Damodaran, January 2026 data): 23.23% for 78 US food processing firms, against an operating margin of 11.00% for the same group. The margin a lost case really takes away is usually higher than gross margin, because direct labour and plant overheads are paid whether the line runs or not. Using gross margin keeps the estimate on the safe side.
Recovery time is the recovery time objective (RTO) in standard terms: the time to make saleable product again, not the time until the machine turns. For a food line it includes part lead time, repair, restart, cleaning and any release testing. The patience of customers is the maximum tolerable period of disruption (MTPD). The plan has a gap wherever RTO is longer than stock cover plus alternate capacity.
Sample figures for illustration only. A plant makes ambient sauces and soups on three lines, two shifts a day, 15 planned hours. The rates are good cases per hour from eight weeks of line data; the prices per case are sample prices; the margin is the NYU Stern floor.
| Per line | Line 1, 500 g jars | Line 2, 300 g jars | Line 3, pouches |
|---|---|---|---|
| Nameplate, cases an hour | 1,200 | 1,400 | 600 |
| Measured OEE (A x P x Q) | 61.9% | 60.3% | 57.4% |
| Measured good cases an hour | 742 | 845 | 344 |
| Sample price a case | EUR 15.80 | EUR 11.40 | EUR 21.60 |
| Margin a case (23.23%) | EUR 3.67 | EUR 2.65 | EUR 5.02 |
| Margin lost an hour | EUR 2,723.14 | EUR 2,239.25 | EUR 1,726.88 |
| Recovery time, worst case | 10 days | 4 days | 14 days |
| Finished stock cover | 3 days | 5 days | 6 days |
The OEE figures come from the usual product of availability, performance and quality: Line 1 is 77.2% x 84.0% x 95.4% = 61.9%, so 1,200 x 0.6186 = 742 good cases an hour. Line 2 is 80.0% x 81.0% x 93.1% = 60.3%, Line 3 72.0% x 83.5% x 95.4% = 57.4%. The OEE calculation guide covers the method.
Read the table for gaps. Line 2 recovers in 4 days and holds 5 days of stock: no gap, so its plan is mostly a parts list and a contact sheet. Line 3 recovers in 14 days with 6 days of stock: an 8-day gap of 41,280 cases, worth EUR 207,225.60 at 344 cases an hour, 15 hours a day and EUR 5.02 a case. Line 1 recovers in 10 days with 3 days of stock, and it is the line the rest of this guide works through.
Why plans built on nameplate rates overstate recovery
Nameplate speed is what the machine builder rates the machine at. Measured output is what the line ships after stops, slow running, rejects and changeovers. On Line 1 of the sample plant, nameplate is 1,200 cases an hour and measured output is 742. If the BIA uses nameplate, it states the money at risk as EUR 4,404.00 an hour, not EUR 2,723.14. That error inflates the loss, which looks like the cautious side.
The bigger error runs the other way, and it sits in the recovery column. Continuity plans count on spare capacity: a night shift on a sister line, a weekend, a second site. If that capacity is valued at nameplate, the plan shows recovery far faster than the plant can deliver. Three things shrink the real figure:
- The alternate line runs below its own rating, and lower still on a format it does not usually run.
- Changeovers eat the spare hours: change parts in at the start of the night, out again before the morning.
- The spare hours are smaller than they look once cleaning, maintenance windows and crew limits come off.
Capacity utilization looks at the same gap for planning. For continuity, the fix is simple: every rate in the plan comes from recent line data, and every alternate route gets a timed trial before the plan relies on it.
Worked example: Line 1 loses its filler for 10 days
Sample figures for illustration only. The filler valve carousel on Line 1 is damaged, and the rebuild parts come from abroad: 10 working days until the line makes saleable product again. Line 1 runs to demand, so customers need 742 x 15 = 11,130 cases a day, 111,300 over the outage. The plan has two answers: 3 days of finished stock (33,390 cases), and night shifts on Line 2 with change parts for the 500 g jar.
The plan as written, on nameplate. The machine builder rates Line 2 at 1,090 cases an hour on 500 g jars. A 7.5 hour night shift gives 1,090 x 7.5 = 8,175 cases. Day 1 goes on fitting change parts and a trial, so 9 nights give 73,575 cases. Covered: 33,390 + 73,575 = 106,965. Short: 4,335 cases x EUR 3.67 = EUR 15,909.45.
The same plan at measured rates. A one-week trial of 500 g jars on Line 2 gave availability 74%, performance 80% and quality 94.5%: OEE 74% x 80% x 94.5% = 55.94%, so 1,090 x 0.5594 = 609.8 good cases an hour. Two format changes of 45 minutes a night leave 6.0 run hours: 609.8 x 6.0 = 3,658.8, so 3,658 whole cases a night; 9 nights = 32,922. Covered: 33,390 + 32,922 = 66,312. Short: 44,988 cases x EUR 3.67 = EUR 165,105.96.
| 10-day outage, Line 1 | Plan on nameplate | Measured rates |
|---|---|---|
| Line 2 rate on 500 g jars | 1,090 an hour | 609.8 an hour |
| Run hours a night | 7.5 | 6.0 |
| Cases a night | 8,175 | 3,658 |
| Covered: stock + 9 nights | 106,965 | 66,312 |
| Cases short | 4,335 | 44,988 |
| Margin lost | EUR 15,909.45 | EUR 165,105.96 |
Reading it. The nameplate plan claims 2.23 times the recovery the plant can deliver, and it puts the loss at about one tenth of what the measured rates show. The alternate route still earns its keep: the 32,922 cases it makes are worth EUR 120,823.74 of margin, against night labour of 7 people x 8 hours x EUR 40.3 = EUR 2,256.80 a night, EUR 20,311.20 for 9 nights, at the Eurostat hourly labour cost for euro area industry in 2025. But it is not enough on its own.
The reserve decision, in money a year. Say the plant's stop record shows a failure of this size about once in ten years (a sample probability; use your own history). The expected loss is then EUR 165,105.96 x 10% = EUR 16,510.60 a year at measured rates, but only EUR 1,590.94 a year on nameplate. Three reserves could close the gap:
- A critical spare kit for the filler (valve set, drive, the parts with the longest lead time): EUR 38,500 on the shelf, sample price. At a sample holding rate of 15% a year it costs EUR 5,775.00 a year, and it cuts recovery to 3 days, inside the 3 days of stock. Net: EUR 16,510.60 minus EUR 5,775.00 = EUR 10,735.60 a year in favour.
- Four more days of finished stock: 44,520 cases at EUR 12.13 cost each (price less margin) ties up EUR 540,027.60. At the same 15% that is EUR 81,004.14 a year, almost five times the expected loss.
- A co-packer on standby: a sample retainer of EUR 21,500 a year, and EUR 1.90 a case above own cost when used. Starting on day 5 at 6,000 cases a day it would cover 36,000 cases for EUR 68,400.00 of premium, still leaving 8,988 short (EUR 32,985.96). The retainer alone exceeds the expected loss.
At measured rates the spare kit wins clearly. On nameplate, the same spare kit costs EUR 5,775.00 a year to cover an expected loss of EUR 1,590.94, so the plan would have rejected it. The rate in the BIA decided the reserve. The co-packer is not wasted thinking, though: it is the only reserve that works if a fire takes out both jar lines, and for Line 3, with no alternate line in the plant and an 8-day gap worth EUR 207,225.60, it is the first option to price. The kit itself should follow a spare parts stocking policy rather than a one-off purchase.
Stock, spares, a second line, a co-packer or insurance: options, costs and who picks which
Every option below buys recovery time or margin. The labour range is sourced (Eurostat 2025, EUR 12.0 to EUR 56.8 an hour across EU countries); the other figures are the sample plant's and only show the shape of the cost.
| Reserve | Cost, sample or sourced | Choose it if |
|---|---|---|
| Hold finished stock | Value at cost x holding rate. Line 1: one day of cover ties up EUR 135,006.90 | Long shelf life, many failure types, recovery only a few days past cover |
| Critical spares | Parts price x holding rate. Line 1 kit: EUR 38,500, EUR 5,775.00 a year | One machine with long part lead times drives the recovery time |
| Alternate line | Change parts plus crew: 7 people for a paid night, EUR 672.00 to EUR 3,180.80 at Eurostat rates | A sister line can run the format, and a timed trial proves the rate |
| Co-packer standby | Retainer plus premium a case. Sample: EUR 21,500 a year, EUR 1.90 a case | Site-wide loss, or no line inside the plant can run the product |
| Dual source an input | Qualification trials and any price gap; ask the buyer for both | A single supplier of an ingredient or pack format can stop a line |
| Business interruption insurance | Premium and waiting period from the broker | The loss is large but rare, and the peril is insurable |
Who usually picks which. The plant or operations manager owns the BIA and the alternate-line trials, because only the plant knows the measured rates. The maintenance lead prices the critical spares against part lead times. Supply chain and the commercial team own stock cover and the co-packer, since both touch customers and shelf life. Finance and the insurance broker own the cover, and should get the BIA numbers before the renewal, not after a claim. In food, QA signs off any product moved to another line or a co-packer, because recipe, allergens and release testing move with it.
One rule of thumb from the sample plant holds generally: physical reserves (spares, stock, change parts) are for failures you expect; contracts (co-packer, insurance) are for failures you hope never to see. Stock carrying costs are covered in more depth in the guide to inventory carrying cost.
Questions to put to your own team, your broker or a co-packer:
- What are the measured good cases per hour of each line over the last eight weeks, and of the alternate line on the borrowed format?
- Which part on each line has the longest lead time, and what would holding it cost a year?
- How many days of each product can ship from stock today, inside shelf life?
- For the co-packer: how many days from our call to the first released case, at what rate, and what retainer holds that slot?
- For the broker: which perils does the policy cover, is machinery breakdown included, what is the waiting period, and how is lost gross profit worked out?
- When was each alternate route last run for real, and did it reach the rate the plan assumes?
Want to see measured rates, stops and losses in money by line on one screen? Book a demo.
Matching each line to a reserve
With the BIA filled in, the choice per line follows a short sequence. Start with the cheapest question: does stock already cover the recovery time? In the sample plant it does for Line 2, which closes that line's decision. Then ask whether one machine with long part lead times drives the recovery, as on Line 1, and whether another line can run the products at a rate you have seen, not one you hope for. Only when neither works, or when the scenario is the whole site, do contracts come first, as for Line 3.
Two warnings apply to every line. First, a reserve that has never been tested is a hope: change parts that have never been fitted, a co-packer who has never run the recipe, a spare that was never checked against the current machine revision. Second, the sequence above handles machine and site failures; single-source inputs need their own row. A jar, a lid or a pouch film from one supplier can stop a line as surely as a broken filler, and the fix is a second qualified source or a deeper stock of that input.
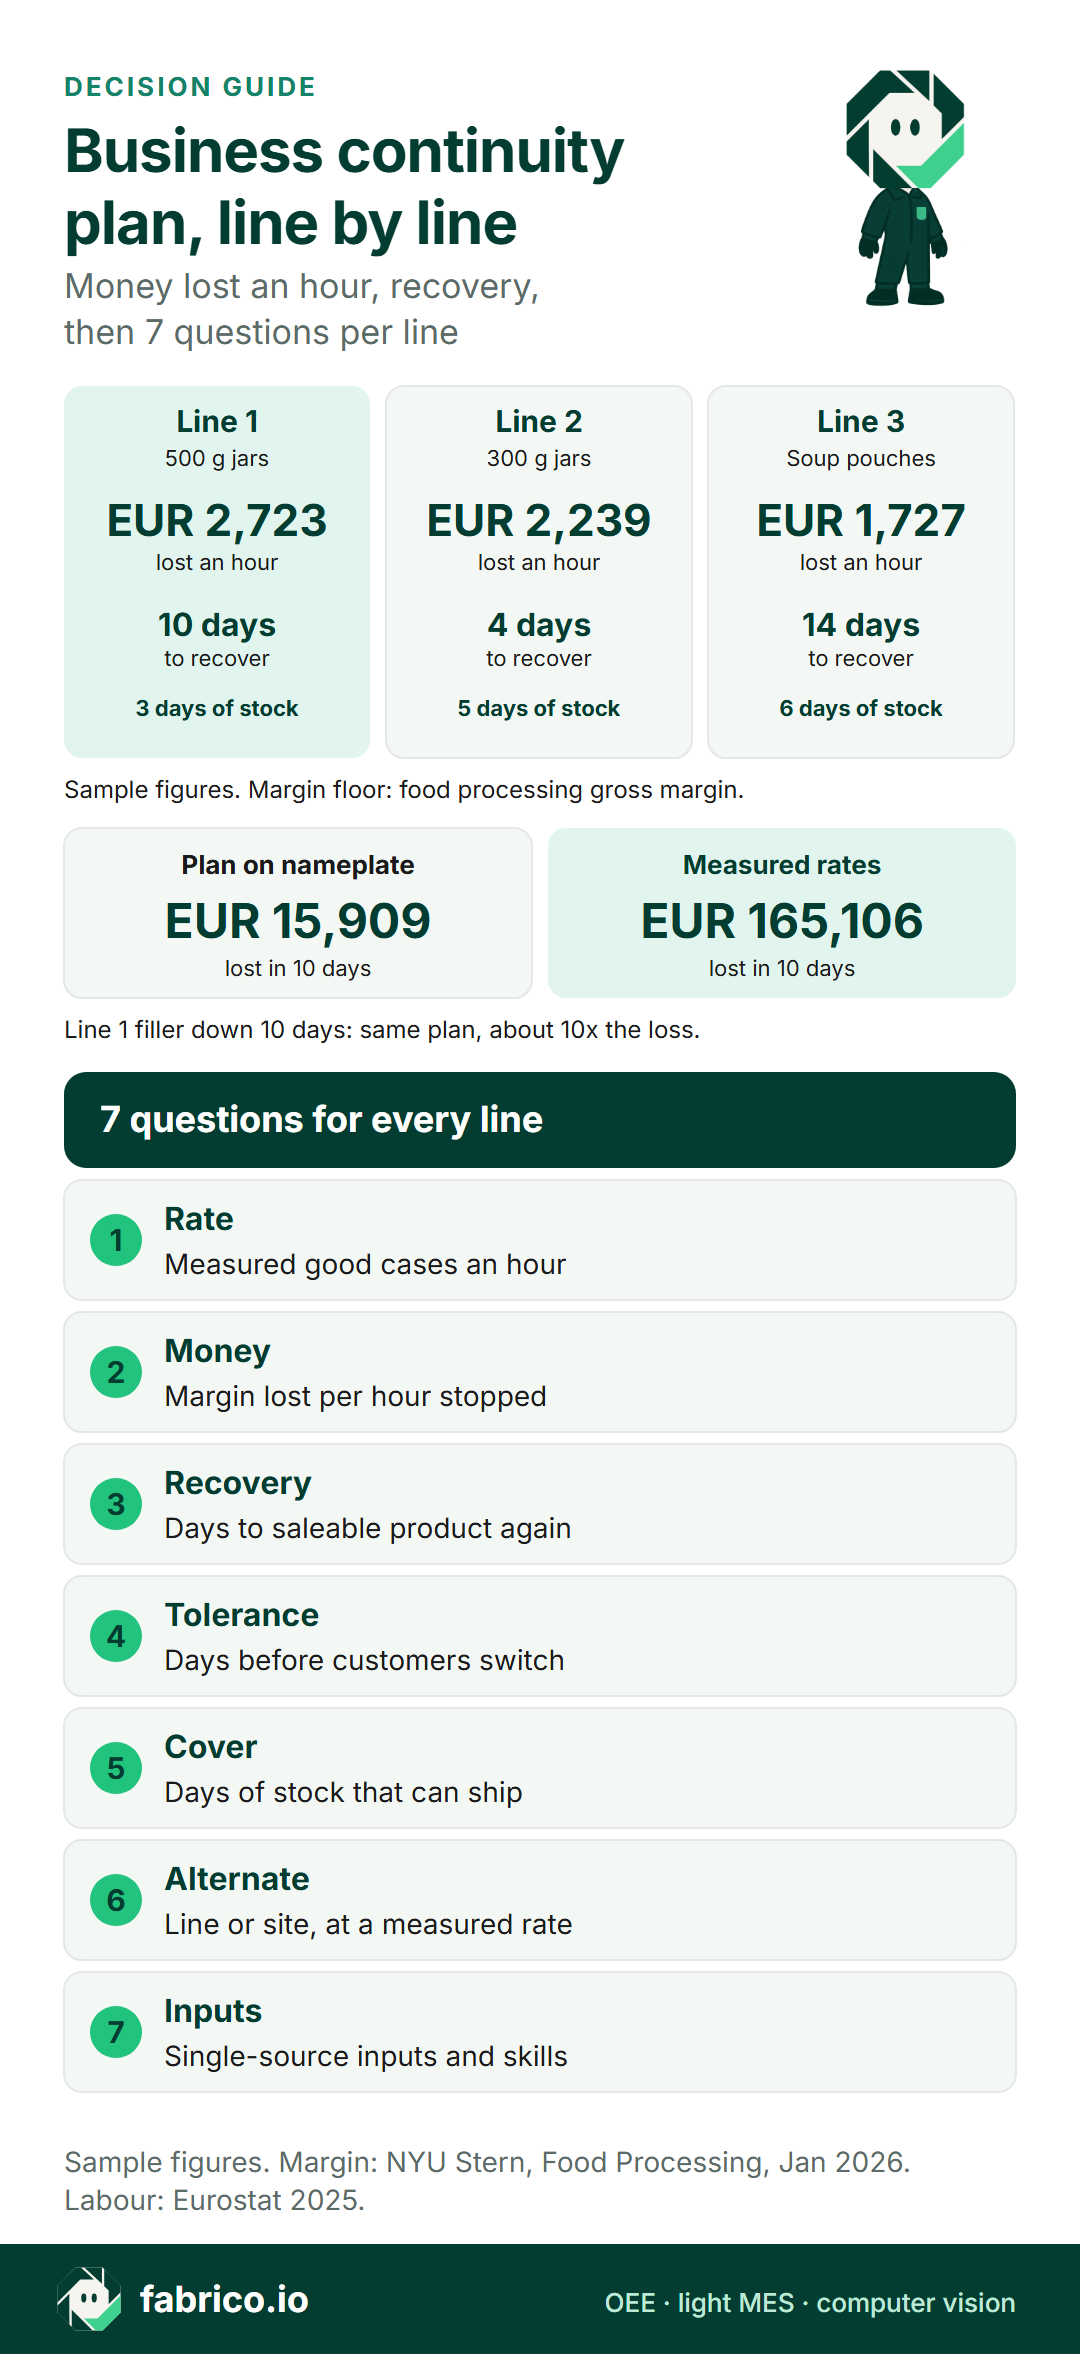
Text version of this infographic
- Line 1, 500 g jars: EUR 2,723 of margin lost an hour, 10 days to recover, 3 days of stock.
- Line 2, 300 g jars: EUR 2,239 of margin lost an hour, 4 days to recover, 5 days of stock.
- Line 3, pouches: EUR 1,727 of margin lost an hour, 14 days to recover, 6 days of stock.
- Line 1 down 10 days: EUR 15,909 lost on nameplate, EUR 165,106 at measured rates.
- Question 1, Rate: Measured good cases an hour over the last 8 weeks, not nameplate.
- Question 2, Money: Margin a case, and so the money lost per hour the line cannot ship.
- Question 3, Recovery: The worst credible failure, and the days it takes to make saleable product again.
- Question 4, Tolerance: How many days customers wait before they delist, fine or switch.
- Question 5, Cover: Days of finished stock that can ship, inside shelf life.
- Question 6, Alternate: Which line or site can run these products, at what measured rate, after which changeover.
- Question 7, Inputs: Single-source ingredients, packaging, utilities and skills the line cannot run without.
- Sample figures. Margin floor: NYU Stern, January 2026.
Keeping the plan honest: test it, then refresh the rates
A continuity plan ages the day it is written. Lines speed up after an improvement project, slow down as machines wear, gain new products and lose old ones. Three habits keep it honest:
- A yearly exercise per critical line. Walk through the worst credible failure with production, maintenance, supply chain, QA and finance at the table. Time each step against the plan.
- A timed trial of each alternate route. Run the borrowed format on the alternate line for a shift and record the rate. That trial is where the 55.9% OEE in the worked example came from.
- A quarterly refresh of the BIA rates from line data: good cases per hour, the long stops of the quarter and their causes. If a filler breakdown took nine days last spring, the RTO in the plan should say so.
The stop record is the input most plans lack. Recovery times in a BIA are often estimates from memory; the record of real stops, with duration and reason, turns them into history. The record is only as good as its reasons, so the guide to downtime reason code design is worth a read before the first exercise, and cost of downtime per minute turns long stops into money.
OEE software keeps both inputs current without extra work: the machine signal records stop time, operators give the cause on a tablet or phone beside the line, and good output per hour builds up shift by shift. A BIA refresh then starts from a report. The video below walks through a line screen, including a stop that is still waiting for its cause.
What you see: a shift timeline, unclassified time waiting for a reason, and the operator's line-down screen, on sample lines. Book a demo.
Plays from YouTube. Google may set cookies when you press play. Privacy policy.
Building the line BIA in 30 days
The first version does not need a consultant or a template pack. It needs four weeks and the right people in the room:
- Week 1: list the lines and pull eight weeks of measured good output per hour for each. Mark the products that only one line can make.
- Week 2: agree the margin per case with finance (gross margin as the floor) and work out the money lost per hour for each line.
- Week 3: with maintenance, name the worst credible failure per line and its recovery time, using the stop record and part lead times. With supply chain, record stock cover and single-source inputs.
- Week 4: find the gaps, price two reserves for each gap, and book a timed trial for every alternate route the plan relies on.
The output is one table per plant, like the one in this guide, plus a short list of reserve decisions with money attached. The broker, the auditor and the board can all read it, and the plant can test it.
Where Fabrico fits
Fabrico is OEE and light MES software. It is not a business continuity or risk management tool. Its part in a continuity plan is to supply the line data the BIA rests on:
- Measured rates. OEE, good output and losses for each line and shift, with the losses priced in money. The MES and OEE solution overview shows how that looks.
- The stop record. A PLC or an IoT device with sensors supplies stops and counts; operators choose the cause from a grouped reason list, so long stops carry a length and a reason.
- Stations without a signal. Where a machine has no usable signal, the camera add-on counts output; the computer vision for MES and OEE page explains it.
- Getting the numbers out. A REST API, webhooks and Excel or CSV export carry the rates into a BIA workbook or a risk register.
Moving products between lines in a recovery is a planning decision, made in the ERP, APS or planning spreadsheet; Fabrico supplies the measured rate per line that the decision needs. For food plants, food manufacturing software sets out how the wider software stack fits together.
Sources, accessed 16.11.2026: BSI, ISO 22301 business continuity management; Allianz Risk Barometer 2026, business interruption; Allianz Commercial, business interruption claims; Munich Re, natural disaster figures 2025; UK National Risk Register 2025; NYU Stern margins by sector; Eurostat hourly labour costs.
Questions plant teams ask about continuity plans
What should a business continuity plan for manufacturing include?
A business impact analysis for each line (rate, money lost per hour, recovery time, stock cover, alternate capacity and single-source inputs), the reserves chosen for each line and why, who decides and calls whom in the first hours, and a test record. IT recovery is one part of it, not the whole plan.
What is a business impact analysis in a factory?
It answers, for each line or process, what the business loses per hour or day when it stops, how long recovery takes, and how long customers will wait. In a plant the useful unit is the line: its measured output, the margin on what it makes, and the products that depend on it.
How do you set a recovery time objective for a production line?
Start from the worst credible failure for that line, such as a filler, sealer or oven breakdown, a fire, or the loss of a single-source input. Add part lead times, repair, restart and the time to make saleable product again. Then compare it with the days customers will wait and the days of stock you hold.
Why use measured OEE instead of nameplate speed in a continuity plan?
Because recovery depends on what the lines really make. In the sample plant on this page, the plan built on nameplate rates showed a 10-day filler outage costing EUR 15,909; at measured rates it cost EUR 165,106, about ten times as much, and that changed which reserve was worth holding.
Does business interruption insurance replace a continuity plan?
No. It pays for insured losses, after a waiting period and within the limits of the policy, but it does not ship product or keep a customer. Ask your broker which perils are covered, whether machinery breakdown is included, and how the lost gross profit is calculated.
How often should a manufacturing continuity plan be tested?
At least once a year, and again after any change that alters the numbers, such as a new line, a new single-source supplier or a lasting change in line rates. If the site holds a food safety certification, ask QA what it requires for testing incident and contingency procedures.
Want measured line rates and a stop record behind your continuity plan? Book a demo.
Related articles



Latest from our blog








Real Fabrico tiles, sample data.