
Changeover time reduction is often one of the fastest ways to free up capacity in a plant. Yet in many factories, changeovers are still measured manually and discussed only after problems have already hit delivery dates. Live OEE data changes this. When you see changeovers in real time, line by line, you can treat them as a controllable, repeatable process instead of an unavoidable disruption.
This article explains how to use live OEE insights to measure, rank and reduce changeover times for each production line. It also shows how Fabrico, a cloud based MES and OEE platform with built in maintenance management, captures the data you need and turns it into practical improvement actions.
Many teams talk about OEE as if it is only about downtime and speed losses during production. In reality, changeovers are a major driver of Availability losses and often a root cause of late orders, overtime and excess inventory. If you track OEE without looking at how each changeover contributes to Availability, you miss a large part of the improvement potential.
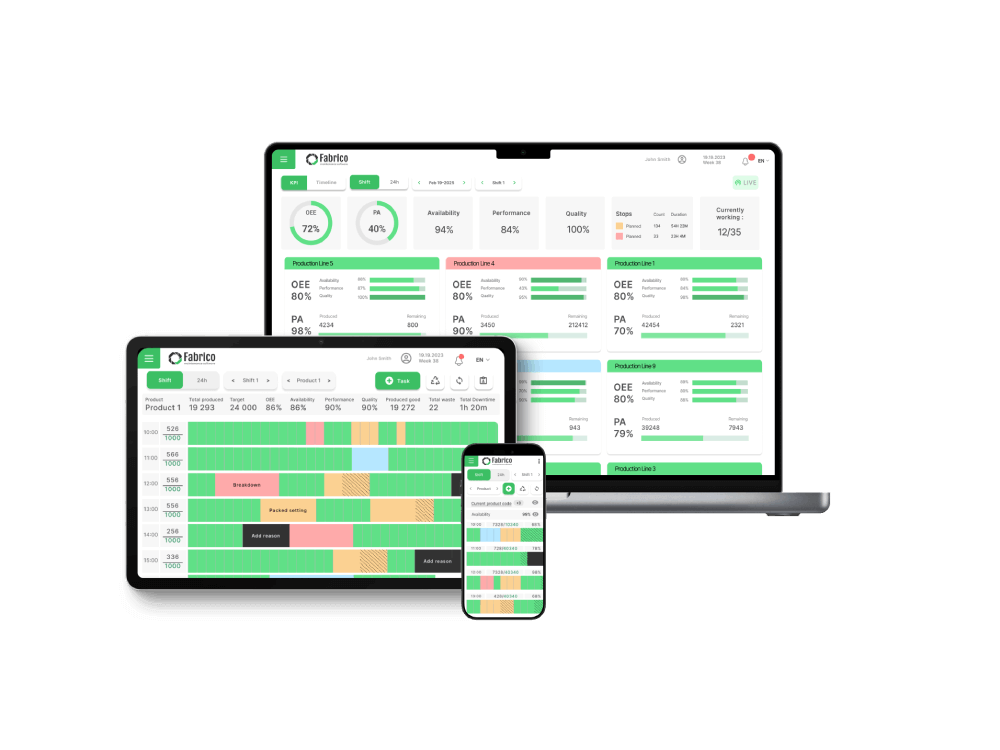
With continuous data collection, changeovers stop being a blind spot. A platform like Fabrico ingests signals straight from machines and production lines, then classifies when a machine is producing, when it is in planned or unplanned downtime, and when it is changing over. This feeds into OEE calculations and gives you consistent, comparable numbers for every line and every product.
To understand how live OEE plays into this, it is useful to revisit the basics of OEE tracking. You cannot reduce what you cannot see. If changeover performance is not visible as part of your day to day OEE view, it will always lose priority to whatever problem is shouting loudest on the shop floor.
The first step is to move from manual stopwatches and spreadsheets to automatic changeover detection. Instead of an operator remembering when a job ended and when the next one started, you can define clear events in the MES and OEE platform. For example, a changeover may begin when production on the last good part stops and end when the next stable batch of good parts is running.
Fabrico connects to machines and line controls to capture state changes with timestamps. Using configurable rules, each changeover can be recognized automatically. This creates a consistent definition of changeover time for each asset, regardless of shift or supervisor. For plants with mixed levels of automation, operators can still confirm or adjust automatically captured events through simple interfaces, without going back to paper or offline tools.
Once data is captured in real time, you can use live OEE views to see which machines are currently in changeover, how long they have been there, and how often they change over in a shift or day. This turns changeover from a monthly KPI into a metric that everyone can see and influence during the shift.
To reduce changeover time, you need more than a total duration. You need a baseline that your teams can own and improve. That baseline is the standard changeover time for each line, product family and change type.
Start with a clear definition of what a standard changeover should include, for example cleaning, tool changes, material preparation, quality checks and parameter setup. Work with line leaders and operators to document the ideal sequence. Fabrico can then store this as a target for each type of changeover on each line.
With a standard defined, every actual changeover is automatically compared to its target. The platform records the start and end time, calculates the variance and feeds it into your OEE calculations. This gives you three essential views:
Using the principles in real time OEE, you can put these views in front of operators and supervisors while they are still in the shift, not days later. Variances stop being abstractions in a report and become concrete gaps teams can act on immediately.
Once you have consistent measurements and standards, you can rank lines by their potential impact on throughput. This helps you focus scarce improvement resources where they matter most. There are several ways to rank:
Fabrico lets you slice these views per site, line, product group and shift so you can see if an issue is systemic or local. For example, if two identical lines have different average changeover times, you can compare their routines and staffing. If one shift consistently runs longer changeovers than others, you know where to focus coaching and standardization.
This ranking is not about blaming teams. It is about giving leadership a clear, data driven view of which assets will yield the greatest benefit from focused changeover reduction efforts.
Measurement alone does not reduce changeover time. The real value comes when each loss is converted into specific actions for maintenance and operations. This is where the built in maintenance management in Fabrico becomes important.
When the platform detects that a changeover exceeded its standard or included unplanned stops, it can automatically create tasks tied to the right asset and team. For example:
Because maintenance management is part of the same platform as production and OEE, you avoid fragmented data and orphaned actions. Each action is linked to specific events and OEE losses, so it is clear why a task exists and what improvement it is meant to support. Over time, you can review which actions delivered the strongest changeover time reduction and replicate them on other lines.
Many manufacturers use SMED methods to reduce changeover time. Live OEE data supports this approach by giving teams objective before and after measurements for each step they change. Instead of running a SMED workshop and waiting weeks to see if the new method stuck, you can monitor the next changeovers in real time.
During SMED projects, operators can tag specific delays during a changeover, for example waiting for tools or materials, difficulty aligning tooling, or repeated quality checks. Fabrico captures these reasons alongside the timeline, so you can quantify how much time each cause is consuming. This makes it easier to prioritize which activities to move from internal to external time and which steps to eliminate entirely.
As improvements are piloted, your live OEE views will show whether the new method reduces average changeover time and decreases variance between shifts. If results are positive, you can lock in the new standard time and procedure. If not, you can iterate quickly without waiting for the month end OEE report.
Changeover reduction is not only about the time between jobs. It is also about how often you change over and in what sequence. With reliable changeover data per product and per line, planners and operations leaders gain the information needed to balance responsiveness with efficiency.
For instance, you can analyze how different product sequences affect total changeover time in a day. You may find that grouping similar SKUs reduces adjustments and cleaning, or that certain product combinations always cause extra verification steps. Fabrico brings together production events and OEE losses so schedulers can see the real impact of schedule decisions and avoid patterns that generate excessive changeover loss.
This insight is particularly valuable when market demand pushes the plant to run shorter batches. Instead of simply absorbing more changeovers as a given, you can simulate their impact on OEE and throughput. Over time, you can refine scheduling rules so that customer service and efficiency both benefit.
Initial changeover reduction efforts often deliver quick wins, but sustaining them across months and years requires transparent, shared metrics. Real time OEE views make changeover performance visible throughout the plant, so improvements remain part of daily management rather than one off projects.
Dashboards in Fabrico can show for each line:
Supervisors can use these views in shift meetings to review how many changeovers ran to standard, which ones overran and why. Continuous improvement teams can use historical data to identify recurring patterns and prioritize their next projects. Maintenance can see which assets or tool sets are associated with frequent changeover delays and plan focused interventions.
For leadership, this level of visibility turns abstract transformation goals into measurable progress. Instead of broad directives to improve OEE, you can set specific targets for changeover reduction on the lines with the greatest opportunity and track progress in a straightforward way.
Fabrico is a cloud based MES and OEE platform designed to bring production and maintenance data together in one place. For manufacturers focused on changeover reduction, this provides several practical advantages:
By combining these capabilities with IoT connectivity and smart manufacturing practices, Fabrico helps manufacturers move from reactive firefighting to structured improvement. You can read more about this approach in Fabrico: Driving OEE Excellence Through IoT and Smart Manufacturing.
If you want to see how this could work in your own environment, including how changeover data would be captured from your specific lines, you can Request a demo.
Reducing changeover time is not a one time project. It is an ongoing discipline that combines accurate measurement, clear standards, focused analysis and practical actions on the shop floor. Live OEE data is the foundation that keeps this discipline alive for every line and every shift.
By using a platform like Fabrico to:
you can cut changeover times, increase usable capacity and improve OEE without major capital investment. The result is a more responsive, efficient plant where improvement work is grounded in facts rather than assumptions.
If you would like to discuss your current OEE and changeover challenges, you can Contact us.
See how Fabrico unifies OEE and maintenance in one platform.
Request a demo











 Login
Login
 Blog
Blog