


 Login
 Blog
Danone's US Yogurt Ramp-Up: What a Slow Start on New Lines Teaches Plants

News, 11 November 2026. Every news figure below comes from a linked source, and the full list is at the end.
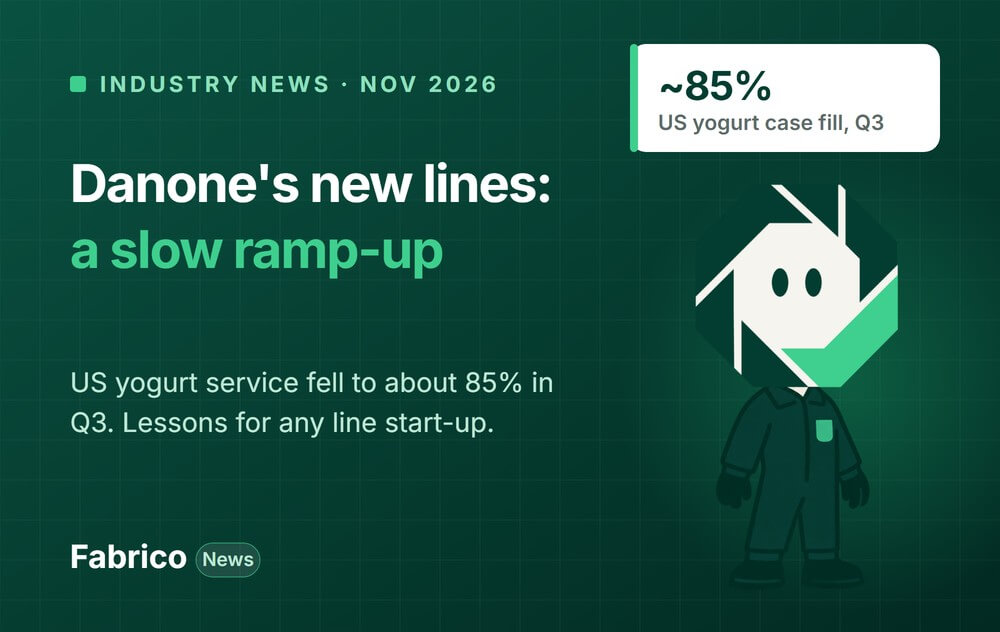
In short: Danone has added new US yogurt capacity, but its new lines started more slowly than planned. On 28 October 2026 it reported that the US yogurt service level fell to about 85% in the third quarter, below its target, and began to recover in early October.
- New capacity on paper is not output. Every new line goes through a ramp-up, and the plan has to allow for it.
- The fix is not exotic: a written ramp-up curve, the same OEE definitions as the old lines, and a daily look at the losses.
- Below: what Danone said, what it means for any line start-up, and three steps.
What Danone said on 28 October 2026
Danone published its third-quarter sales on 28 October 2026. Group like-for-like sales grew 4.0%, according to its results presentation. North America grew 2.4% on €1.7 billion of sales, with price up 3.0% and volume/mix down 0.6%.
The same presentation says Danone has run 8 capacity expansion projects across 4 factories since December 2025, so "capacity is no longer a limiting factor". It also says the capacity ramp-up was slowed by operational disruptions.
A chart on that slide tracks the US yogurt service level as a case fill rate. It marks about 85% for the third quarter, the low point on the chart, then an upturn in the first weeks of October that is still below the target line. The slide does not give the target figure.
On the earnings call, CFO Juergen Esser, speaking about North America, said the 8 projects were spread across 4 of 13 existing factories. He said: "We did encounter issues in the third quarter in starting up those lines."
He added that service started to improve in October, and that fixing customer service is the job of the fourth quarter. He also said there were no delistings to report.
Food Dive reported on 29 October that demand for yogurts such as Oikos and Activia has grown with the GLP-1 trend. The investment includes expanding a facility in Fort Worth, Texas and growing and upgrading its yogurt facility in Minster, Ohio. Danone also named Francois Lacombe president of Danone U.S.
What it means for plant managers
A new line rarely makes its rated output in week one. Commissioning faults stop it, crews are still learning the changeovers, it runs below rated speed while settings are tuned, and start-up scrap is high.
Danone's case shows what happens when output lags the plan. Esser said the slow start was disturbing the whole supply chain, and the presentation shows service at about 85% in the third quarter. The capacity was in place; the output came later.
We do not know how Danone planned its ramp-up. The general lesson is not that ramp-ups fail. It is that sales, planning and the plant need the same realistic curve. A plan that assumes nameplate output from day one puts the shortfall on the customer.
Why a slow start costs cases: a worked example
Example data, not Danone's. A new cup filling line is rated at 120 cups a minute and planned for 1,000 minutes a day. At 100% OEE that is 120,000 cups.
| Week | OEE | Good cups a day | Against a plan at 70% |
|---|---|---|---|
| Plan, every week | 70% | 84,000 | - |
| Week 1 | 35% | 42,000 | 42,000 short (50%) |
| Week 4 | 53% | 63,600 | 20,400 short (24%) |
| Week 8 | 66% | 79,200 | 4,800 short (6%) |
If the old supply was cut on the plan's date, those shortfalls become missed cases. A plan that follows the measured curve instead keeps the old supply or the safety stock until the new line catches up.
Three steps for your next line start-up
- Write the ramp-up curve before the line arrives. Agree with the supplier and planning a weekly OEE or output target for the first 12 weeks, and the point where the line is accepted. Our guide to new line cost vs recovering capacity covers the business case side.
- Measure the new line from day one, the same way as the old ones. Same planned time rules, same stop reason list, a rated speed for each product, rejects counted. Different definitions make the new line look better or worse than it is. See nameplate vs real capacity.
- Review the losses daily and feed real rates to planning. Rank the top three losses each morning and give each one an owner. Send planning the measured rate every week, not the nameplate, until the curve is met. Daily routines are in line start-up standard work.
Where OEE, cameras and light MES help
OEE on a new line shows which part of the ramp-up lags: stops (availability), slow running (performance) or start-up scrap (quality). Each has a different owner.
A light MES puts a reason on each stop as it happens, so commissioning faults and learning-curve stops are separated from the start. That is the list the supplier and the plant work through together.
Some new lines arrive before their machine data is connected. An AI camera (an add-on) that counts output gives a real count per shift in the meantime, so the ramp-up curve is measured, not estimated.
How Fabrico does it
Fabrico is a cloud OEE and light MES platform. Once a line is connected through its PLC or a Fabrico IoT device with sensors, stops and speed show per shift, and operators add stop reasons on a tablet or phone. Where a station has no signal, AI cameras (an add-on) count output. You can open their video for any moment on the timeline. It is streamed on request, not stored. We have no link to Danone and make no claim about its plants; this is how we would track any new line's first weeks.
Starting up a new line soon? Book a demo and bring your ramp-up plan.
What people ask next
Why was Danone's US yogurt supply short in 2026?
Danone said on 28 October 2026 that the ramp-up of new US capacity was slowed by operational disruptions. CFO Juergen Esser said there were issues starting up the new lines in the third quarter, and the presentation shows the US yogurt case fill rate at about 85% in the third quarter, below target, with an upturn in early October.
What is a case fill rate?
It is the share of ordered cases a supplier actually ships. Companies define it in slightly different ways, for example by order line or by date, so check the definition before comparing figures.
How long does a new production line take to ramp up?
There is no standard figure; it depends on the equipment, the products and the crew. Agree a weekly curve with the supplier before start-up, measure against it from day one, and plan on the measured rate until the line is accepted.
Sources
Checked on 11 November 2026. Dates are the publication dates shown on each page.
- Danone, Q3 2026 sales presentation (slides 2, 7 and 11), 28 October 2026
- Investing.com, Danone Q3 2026 earnings call transcript, 28 October 2026
- Food Dive, Danone changes US leadership in 'offensive phase' of its turnaround, 29 October 2026
Related articles

Latest from our blog



Real Fabrico tiles, sample data.