







 Login
 Blog
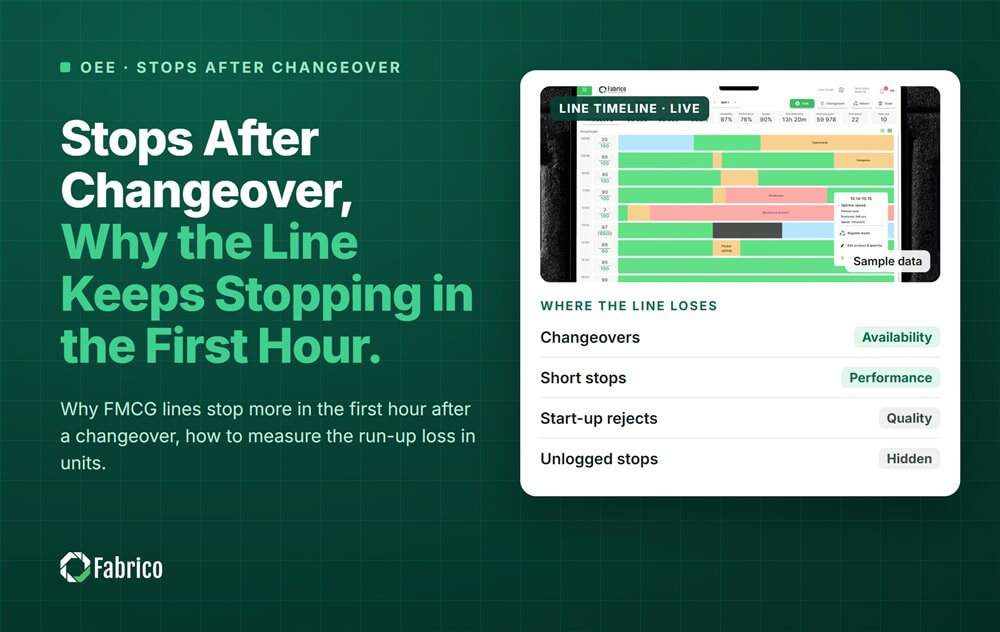
Stops After Changeover: Why the Line Keeps Stopping in the First Hour

Key takeaways
- A changeover ends at the first good unit at rated speed, not at the first unit off the machine.
- The run-up after a changeover hides in short stops and slow running, so it rarely shows up as changeover time.
- Measure stops per hour and speed in the first hours after each changeover, by SKU pair.
- Centerlines per SKU are the most common fix.
- Give run-up stops a flag of their own so they do not mix with normal short stops.
Lines stop more after a changeover because the settings are new, parts are not fully adjusted and the materials have changed. The first hour often has more short stops and slower running than the rest of the run, and that run-up loss can be as big as the changeover itself.
Fabrico, an OEE and light MES platform, logs each stop with its start and end and shows OEE live by line and shift, which makes the run-up curve after each changeover visible. This guide shows where the changeover really ends, why the line keeps stopping, how to measure the run-up in units, and what shortens it.
When does a changeover really end?
The trade definition is clear: a changeover runs from the last good unit of SKU A to the first good unit of SKU B at rated speed. That includes cleaning, format parts, settings and the ramp-up.
Many plants stop the clock earlier, when the first unit comes off the machine. The changeover then looks short, and the minutes spent getting the line stable move somewhere else: into short stops and into Performance. The changeover standard looks fine while the line struggles for an hour. Our guide to changeover time covers the basics of measuring it.
Why does the line keep stopping after a changeover?
- Lost centerlines. A guide or setting was moved by hand, and nobody knows the right position for this SKU. The crew adjusts by feel until it runs.
- Change parts. Worn, mixed up or not fully locked format parts cause jams until they settle.
- New material. A new label roll, film or case blank lot behaves differently from the last one.
- Settings not written down per SKU. Speeds, temperatures and timings are set from memory.
- Cold or unsettled parts. Seal bars, glue systems and heated sections need time to reach a steady state.
- Rushing the restart. The line is pushed to full speed before it is stable, which creates more stops.
Studies of packaging lines describe a start-up curve that occurs after every restart. The question is not whether there is one, but how long it lasts and how much it costs.
How do you measure the run-up loss?
| Measure | How to get it | What it tells you |
|---|---|---|
| Changeover to first good unit | Last good unit of A to first good unit of B | The changeover most plants report |
| Time to rated speed | First good unit to the first stable hour at rated speed | How long the run-up lasts |
| Stops per hour after restart | Stops in hour 1 and hour 2 against the run's normal hour | How unstable the line is |
| Speed while running | Units made divided by running minutes, hour by hour | Slow running after the change |
| Rejects in the first 30 minutes | Rejects after restart against the run's normal rate | Quality loss from settings |
Split every measure by SKU pair. A change from a small pack to a big pack rarely behaves like the reverse.
What does a run-up after changeover look like?
Sample line (illustrative numbers, not a customer): a snack bagging line rated at 120 bags a minute, with a 30 minute changeover standard. In a stable hour the line has 2 short stops (3 minutes) and runs at 116 bags a minute while running. After one changeover:
| Hour after changeover | Stops | Stop minutes | Speed while running | Bags made |
|---|---|---|---|---|
| Hour 1 | 11 | 22 | 90 a minute | 3,420 |
| Hour 2 | 4 | 6 | 112 a minute | 6,048 |
| A stable hour | 2 | 3 | 116 a minute | 6,612 |
- Hour 1: 90 bags x 38 running minutes = 3,420 bags, which is 6,612 minus 3,420 = 3,192 bags short of a stable hour.
- Hour 2: 112 x 54 = 6,048 bags, another 564 bags short.
- Run-up loss: 3,192 + 564 = 3,756 bags, about 31 minutes of output at the rated 120 a minute.
- So the real changeover cost is closer to 61 minutes than 30. Half of it never appears in the changeover report.
With three changeovers a day, that is more than an hour and a half of hidden loss every day on one line. None of it looks like a changeover in a paper log; it looks like a bad first hour.
Which fixes shorten the run-up?
- Centerlines per SKU. Mark and record the right position of every guide and setting, and check them at each changeover.
- Change part kits. One trolley per format, parts marked, worn parts replaced on a schedule.
- Settings written per SKU. Speeds, temperatures and timings on a sheet or screen, not in someone's head.
- Material checked before the change. The next labels, film and blanks are at the line and checked before the old run ends.
- SMED. Separate internal steps (machine stopped) from external steps (prepared while it runs), and move as many as possible to external. Our SMED guide explains how.
- A run-up target per SKU pair. For example, the stable hour's stop rate by the end of hour 2. Then track it.
How should run-up stops be coded?
Keep two things apart in the data:
- Changeover over standard: the minutes the changeover itself ran over its standard, up to the first good unit.
- Run-up stops: the normal stop codes, with a flag that says they happened in the first hours after a changeover.
With the flag, you can compare run-up stops with normal short stops on the same machine. If a labeller has three times as many glue skips after a change, the fix is in the changeover routine, not in the labeller. For the difference between slow running and short stops, see reduced speed loss vs minor stops; for how short stops add up, see micro stops on packing lines.
Where Fabrico fits
Fabrico is a computer vision enabled Manufacturing Performance Platform. OEE and light MES come first, with computer vision on stops.
- Automatic downtime logging, so every run-up stop has a start and an end.
- OEE live by line and shift, hour by hour, so the run-up curve is visible after each change.
- The operator confirms the reason in one tap, and a camera clip can serve as evidence for a stop.
- Every loss priced in money and ranked, so you see what each SKU pair's run-up costs.
You start with a pilot on one line, with a baseline and a decision date agreed in advance. There is no free plan and there are no tiers: each plant gets a quote. See how stops are captured on our computer vision OEE page.
Frequently asked questions
Why does my line stop more after a changeover?
New settings, change parts that are not fully adjusted, new material lots and missing centerlines. The line needs time to become stable, and each stop in that time is part of the changeover cost.
When does a changeover end?
At the first good unit of the new product at rated speed. Stopping the clock at the first unit off the machine hides the run-up.
Is the run-up part of changeover time in OEE?
By the trade definition, yes. In practice many plants count it as short stops and slow running, so measure it separately to see it.
How long should the run-up take?
There is no general figure. Set a target per SKU pair from your own data, such as reaching the normal stop rate by the end of the second hour, and track it.
How do centerlines help after a changeover?
They give every guide and setting a known right position for each SKU, so the crew sets the line once instead of adjusting by feel until it runs.
See your changeover's hidden half
Bring one line and a week of changeovers. We will show the run-up after each one and what it cost.


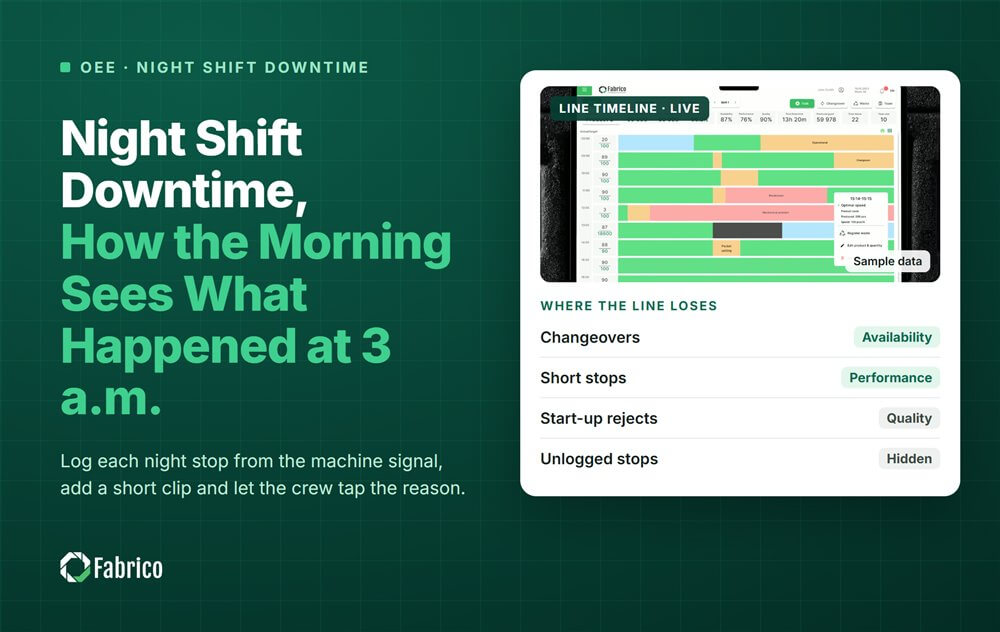





Real Fabrico tiles, sample data.