


 Login
 Blog
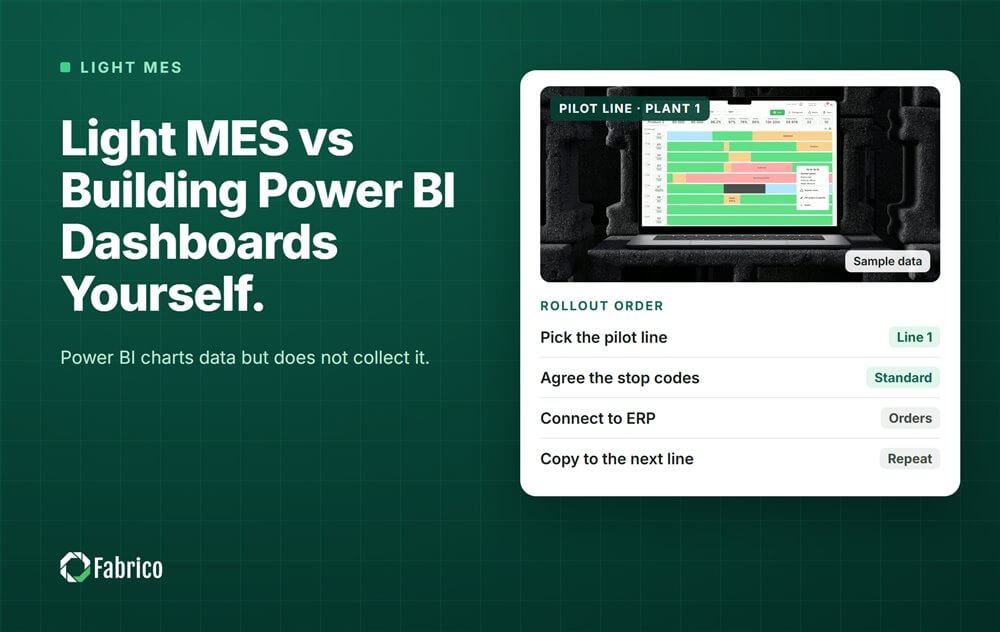
Light MES vs Power BI: Should You Build OEE Reporting Yourself?

Key takeaways
- Power BI shows data but does not collect it; a light MES (manufacturing execution system) captures stops and counts at the machine.
- The OEE (overall equipment effectiveness) can match on both; the difference is whether the losses have causes.
- Power BI fed by shift sheets is memory with charts.
- Build it yourself when machine data already sits in a database and you have people to keep the model running.
- Many plants use both: a light MES at the line, Power BI for company reporting.
A light MES collects OEE data at the machine: stops, counts and the reason for each stop, confirmed at the line. Power BI shows data that already exists somewhere else. Build OEE reporting in Power BI yourself only if the data underneath comes from the machine; on shift sheets, it charts what people remembered.
Tuesday morning, the bottling plant's OEE report opens in Power BI. The chart says the labeller had one long stop on night shift. Nobody wrote down the dozens of short stops at the label reel splice, so they are not on the chart.
This guide is for plant managers, continuous improvement leads and IT (information technology) teams deciding whether to build or buy. It compares what each does, job by job, and shows when building it yourself makes sense. This guide comes from Fabrico, a platform for OEE and light MES with computer vision on stops.
What is the difference between a light MES and Power BI?
A light MES captures production data at the line. Power BI, Microsoft's business intelligence (BI) tool, models and charts data from files, databases and services that already hold it.
- Power BI is good at joining data from many sources, building reports and sharing them across a company. It reads what a source already holds; on its own, it does not collect machine states or stop reasons.
- A light MES sits at Level 3. It logs machine states and counts, asks the operator for a stop reason, and computes OEE as the shift runs.
So the real question is not which tool is better. It is where the data comes from. Our guide to light MES explains the layer itself.
What does Power BI show when the data comes from shift sheets?
It shows what the shift lead wrote down at the end of the shift, with good charts on top. That is memory with charts.
- Long stops appear, often rounded to the nearest five or ten minutes.
- Short stops rarely appear, because nobody logs dozens of short jams by hand.
- Reasons are whatever fits the form: labeller, waiting, other.
- The data arrives the next morning, after someone types it in.
This is the common case, not the rare one. IoT Analytics' MES market report 2025 to 2031 finds that 54.4% of small and medium manufacturers still run on pen and paper or spreadsheets.
Our guide to light MES vs spreadsheets covers how to retire those tabs one by one.
How do a light MES and Power BI compare, job by job?
Compare them by what each does for the line, not by the charts. Each one wins some rows.
| Job | Light MES | Power BI built in house |
|---|---|---|
| Data capture from the machine | Logs states and counts from the programmable logic controller (PLC), a sensor or a camera | Needs a data source someone else builds |
| Reason at the line | The operator picks it on a screen when the stop happens | Only if your team builds and keeps an entry screen at the line, for example in Power Apps |
| Short stops | Counted from the machine signal | Missing unless the source records them |
| OEE during the shift | Live by line and shift | At each scheduled refresh, or near live if it reads a live source through DirectQuery |
| Definitions | Kept in one place | In one shared semantic model if the BI team builds it that way; often copied into each report |
| Effort to keep it running | The supplier maintains the product | Your team maintains the model, the feeds and the sheets |
| OEE next to sales or finance data | Limited to production | Strong: this is what it is built for |
Our guide to lightweight MES for small manufacturers shows the left column in a plant with a small team.
When does building it yourself in Power BI make sense?
When clean machine data already exists and you have people to look after it. Then Power BI adds a lot, quickly.
- The lines already feed a historian or database with machine states and counts.
- Stop reasons are already captured at the line, not typed in later.
- A BI team can own the model, the refresh and the OEE formulas.
- You need OEE next to sales, finance or energy data in one company report.
It makes less sense when the only source is the shift sheet. Then the team spends months building a model on numbers the line does not trust.
Our OEE dashboard guide covers which charts a line team actually reads.
Can you use a light MES and Power BI together?
Yes, and many plants do. The light MES captures and computes at the line; Power BI carries the result into company reporting next to other data.
- Keep the OEE definitions in one place, the light MES, so the two never disagree.
- Send Power BI totals by line and shift, not raw machine signals.
- Ask any supplier how its data reaches your BI tool, and get the answer in writing.
A worked example: the same shift on paper and from the machine
Sample line (illustrative numbers, not a customer): a water line filling PET (polyethylene terephthalate) bottles, filler rated at 250 bottles a minute. The shift has 460 planned minutes. The counter shows 82,500 bottles made and 81,250 good, and both reports use it.
| Loss | Shift sheet in Power BI | Machine data |
|---|---|---|
| Labeller stop | 20 min | 20 min |
| Filler jam | 15 min | 15 min |
| Label reel splice, 18 short stops | Not recorded | 13 min |
| Bottles tipped at the infeed star wheel, 22 short stops | Not recorded | 16 min |
| Cap chute blocked, 8 short stops | Not recorded | 12 min |
| Rejects, 1,250 bottles | 5 min | 5 min |
| Slow running | Not split out | 54 min |
| Not explained | 95 min | 0 min |
| Total lost minutes | 135 | 135 |
- OEE on both: 81,250 / 250 / 460 = 325 / 460 = 70.7%. The number is the same.
- Lost minutes on both: 460 minus 325 = 135.
- The sheet explains 20 + 15 + 5 = 40 minutes. The other 95 show up as one speed loss bar with no cause.
- The machine data names 13 + 16 + 12 = 41 minutes of short stops, from 48 stops, and measures 54 minutes of slow running.
- The 41 short stop minutes are 41 x 250 = 10,250 bottles. At a contribution of $0.06 a bottle: $615 a shift, or €615 in a euro plant at €0.06 a bottle. Over 700 shifts a year: $430,500, or €430,500.
Both reports say 70.7%, so the headline does not settle the choice. The sheet-based one cannot say where 95 minutes went.
The machine data shows the labeller costs 33 minutes once its 18 splice stops are added. It also shows 54 minutes of slow running that no sheet explained. So the first fixes are the label reel splice and the filler's speed; the 16 minutes at the infeed star wheel come next.
Mistakes plants make when they build OEE reporting in Power BI
- Building the model before fixing the data source.
- Typing shift sheets into a database and calling it automatic.
- Writing the OEE formula differently in each report.
- Reading a big speed loss bar as a slow line, when it hides short stops.
- Leaving one person as the only one who understands the model.
Where Fabrico fits
Fabrico is a computer vision enabled Manufacturing Performance Platform. OEE and light MES come first: the data is captured at the machine before anyone charts it.
- Automatic downtime logging from the machine signal, short stops included.
- The operator confirms the reason in one tap, at the line, when the stop happens.
- OEE live by line and shift, with the definitions in one place.
- Losses ranked by money, so the costliest short stop cause rises to the top.
You start on one line, with a baseline and a decision date agreed in advance. There is no free plan and there are no tiers: each plant gets a quote. Read how the layer works in our light MES guide.
Frequently asked questions
What does a light MES do that Power BI cannot?
It collects the data at the line: machine states, counts, and the reason for a stop, confirmed by the operator when it happens. It computes OEE during the shift on locked definitions. Power BI can show all of that, but only once something has captured it.
Why does our Power BI OEE not match the line?
Usually because the inputs differ. The report may use typed shift sheets, a different planned time, or a formula written differently on each page. Check the good count, the ideal rate and the planned time against the machine. If short stops are missing, the loss sits in one speed bar with no cause.
What does it take to keep a Power BI OEE model running?
Someone who owns the data feeds, the refresh, the OEE formulas and the changes when a line or a product changes. The model needs care each time the plant adds a format, a machine or a shift pattern. Plan that effort before you build, and name a second owner.
Who should own OEE reporting, IT or operations?
Operations should own the definitions and the line data. IT owns the connections, security and company reporting. If IT builds the Power BI model, write the OEE definitions down with the plant first. Then a change to planned time or the ideal rate stays an operations decision, made in one place.
See a machine-captured shift in a demo
Bring one line and last week's Power BI OEE report. We will show the same shift from the machine, with the short stops and what each cause cost.
Latest from our blog


Real Fabrico tiles, sample data.