


 Login
 Blog
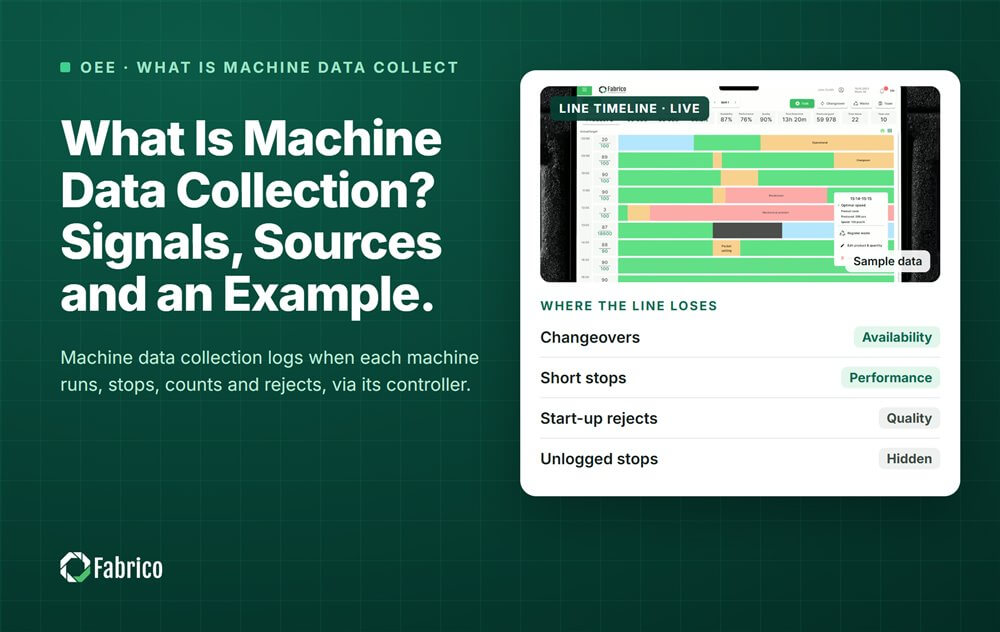
What Is Machine Data Collection? Signals, Sources and an Example

Key takeaways
- Machine data collection captures four signals without a clipboard: run state, cycle count, fault code and quality flag.
- The signals come from the PLC (programmable logic controller), a retrofit sensor or an AI camera. The operator adds the reason for a stop.
- Shop floor data collection is what people enter. Machine data collection is what the machine reports. A plant needs both.
- Machine data feeds OEE (Overall Equipment Effectiveness) live by line and shift and downtime by cause.
By the numbers
- Only 8% of the world's roughly 5 million factories use a commercial MES; many more rely on homegrown tools, ERP add ons, spreadsheets or paper. (IoT Analytics, 2025)
- Large plants suffer an average of 25 unplanned downtime incidents a month, down from 42 in 2019. (Siemens, 2024)
- Getting production running again after an unplanned stop takes 81 minutes on average, up from 49 minutes five years earlier. (Siemens, 2024)
Machine data collection (MDC) is the automatic capture of what a machine does, taken straight from the machine with nobody writing it down. The core signals are run state, cycle count, fault code and quality flag, each with a time stamp.
Fabrico is a computer vision enabled Manufacturing Performance Platform. Machines connect to it through a PLC, a Fabrico IoT device or an AI camera, and it shows OEE live by line and shift. This guide covers the signals, where they come from and what they feed, with a sample shift.
What signals does machine data collection capture?
Four signals cover most of what OEE and a stop list need:
| Signal | What it says | What it feeds |
|---|---|---|
| Run state | Running, stopped, idle or switched off | Availability and the stop list |
| Cycle count | One pulse per unit or per cycle | Total count, so Performance |
| Fault code | Which alarm the machine raised | A first hint for the stop reason |
| Quality flag | A unit was rejected | Good count, so Quality |
Each signal needs a time stamp set at the source, by the PLC or the gateway, not when it reaches the database. Keep every device clock in sync. If clocks drift, stop start and end times drift with them.
The plant also decides when a short pause counts as a stop. No standard sets that cutoff, so write yours down and use it on every line.
Where does machine data come from?
Four sources give the signals, and one person gives the reason:
- The PLC. Read run state, counts and fault codes from the controller, and never write to it. Tag names vary by brand, so map them once per machine.
- The signal tower. The stack light already shows the machine state. Wired in parallel, it gives a run signal with no change to the PLC program.
- A retrofit IoT device with external sensors. A current clamp shows whether the motor draws power, so running or idle. A cycle sensor counts units or strokes. This is how a machine with no PLC gets connected.
- An AI camera. It counts output and records stops on manual and packing stations where no machine signal exists. It watches the process, not the person.
- The operator. The machine knows that it stopped, not why. The operator adds the reason, ideally in one tap.
Many lines use a mix: the PLC where its signal is reliable, sensors on older machines, a camera where people do the work. Our guide to what a PLC does in a plant explains the controller, and OEE monitoring without a PLC covers machines that have none.
How is machine data collection different from shop floor data collection?
Shop floor data collection is what people enter on the floor: order start and end, product, crew, stop reasons, hand counts of scrap and comments. Machine data collection is what the machine reports by itself.
- What it does well: machine data gives exact times and counts. People give reasons, orders and context.
- Weak spot: machine data knows that a stop happened, not why. Manual logs forget short stops and round the times.
So the two work as a pair. The machine says when and how long. The person says why, and whether it was planned.
What does machine data collection feed?
- OEE live by line and shift. Run state gives Availability. Cycle count against the ideal cycle time gives Performance. The quality flag gives Quality.
- Downtime by cause. Each stop has a start, an end, a length and a reason, so a Pareto chart shows the top losses.
- Losses in money. Stop minutes x line rate x margin puts a price on each loss.
For the OEE side, read how to collect OEE data you can trust and our comparison of manual, PLC and camera methods.
What does a machine data collection example look like?
Sample line (illustrative numbers, not a customer): a juice bottling line, one shift of 480 planned minutes. The filler is the bottleneck, with an ideal cycle time of 0.5 seconds a bottle (120 bottles a minute).
| Machine | Source | What it captured in the shift |
|---|---|---|
| Filler | PLC, read access | Run signal on for 432 minutes, 46,080 bottles, 9 stops of 48 minutes in total |
| Labeller | Retrofit device: current clamp and cycle sensor | 3 stops, 21 minutes in total |
| Checkweigher | Reject signal (quality flag) | 480 bottles rejected |
| Hand packing | AI camera | 3,800 cases of 12 counted, 2 short stops saved as clips |
Method note: Sample line, illustrative numbers, not a customer. Every result above comes from the inputs listed and the formula shown with it, so you can repeat the calculation with your own line's numbers.
The arithmetic:
- Availability = 432 / 480 = 90.0%.
- Performance = (0.5 s x 46,080) / (432 x 60 s) = 23,040 / 25,920 = 88.9%.
- Good count = 46,080 minus 480 = 45,600. Quality = 45,600 / 46,080 = 99.0%.
- OEE = 0.900 x 0.889 x 0.990 = 79.2%.
- Check: 45,600 x 0.5 s = 380 minutes, and 380 / 480 = 79.2%.
Three of the filler's stops start just after the labeller's three stops. The filler was blocked, so those stops belong to the labeller, not the filler. The camera counted 3,800 cases, which is 45,600 bottles, the same as the good count. The counts tie out.
The money: 48 stop minutes x 120 bottles = 5,760 bottles not made. At a sample margin of $0.10 a bottle (or €0.10 in a euro plant), the stops cost $576 in one shift.
How do you start machine data collection on a line?
- Pick one line, ideally the bottleneck.
- List the four signals for each machine and where each one will come from.
- Read the PLC without writing to it. Add sensors or a camera where there is no signal.
- Agree the stop cutoff and a short reason list with the operators.
- Check the counts against packed cases and the shift report until they tie out.
With Fabrico, the machine itself needs no PLC. Devices are connected in about one month, and full rollout takes 3 to 4 months. Stops are logged automatically, the operator confirms each reason in one tap, and the camera clip stays as evidence. Losses are ranked by money.
There is no free plan and there are no tiers: each plant gets a quote. See how stops get a reason and a clip on the computer vision OEE page. To compare tools, read our 2026 review of manufacturing data collection software.
Proof from a named plant: Ficosota raised factory-wide OEE from 53.1% to 59.6%, with good output up 23.2% a month from June to September 2026. Read the Ficosota case.
Toyota describes the andon in plain words: when equipment stops, it "lights up to notify workers of the abnormality." (Toyota, Toyota Production System)
Frequently asked questions
What is machine data collection software?
It is software that receives machine signals, stores them with time stamps and turns them into OEE, stop lists and shift reports. It may read the PLC, retrofit sensors or cameras. Look for PLC reading without writing, clear stop rules and a fast way for operators to add reasons.
Do I need a PLC to collect machine data?
No. A retrofit device with a current clamp shows when a machine runs, and a cycle sensor counts units. On manual or packing stations, an AI camera can count output and record stops. Where a PLC exists, reading it is usually the cheapest source of exact times and counts.
Is machine data collection the same as an MES?
No. Data collection is one function of an MES (manufacturing execution system). The MESA-11 model, now with ISA, lists it as one of 11 functions, next to performance analysis. A light MES puts machine data, OEE and downtime first, and starts on one line.
Can machine data tell you why a machine stopped?
Partly. A fault code names the alarm, but many stops raise none: a starved infeed, a jam cleared by hand, missing material. A person confirms the reason. An AI camera can suggest a likely reason and keep the clip as evidence, and the operator confirms it in one tap.
Is it safe to read data from a PLC?
Read the PLC and never write to it. Ask the vendor's technical team where their gateway sits on your network. Have your IT team and controls engineer sign off before the first machine is connected, and let them see every tag that is read.
Latest from our blog






Real Fabrico tiles, sample data.