
Board members care about three things before anything else: profit, cash, and risk. When you present OEE to them, your message has to start and end there. Charts, machine codes, and technical details are useful for you and your team, but at board level they must be translated into money and capacity.
This article shows how to present OEE results in clear, non-technical language, how to talk about losses in terms of financial impact and capacity, and how a platform like Fabrico can support that story by turning every loss into actionable tasks for production and maintenance.
When you speak to the board about OEE, avoid starting with the formula or how OEE is calculated. Begin with outcomes. Your first slide or first paragraph should answer these questions:
OEE is only the bridge. The board wants the destination. That destination is extra profit, more capacity without new capex, and lower operational risk from unplanned stops and unpredictable output.
Most board members do not need to remember the OEE formula. They do need to understand what it represents. A simple way:
You do not need to quote target values or benchmarks. Instead, talk about direction and opportunity. For example, you can say that a higher OEE means more finished product from the same machines, people, and shifts, and that your focus is on the specific losses that keep that number lower than it could be.
For a deeper explanation of how OEE works in real factories, you can also reference content like Fabrico’s insights on OEE and smarter manufacturing at this article, and adapt that content to your own environment.
The strongest story for the board is not “our OEE is X”. The strongest story is: “Here is where we are losing production today, and here is what that means in value and capacity.” Even if you do not share exact figures, you can present the logic:
The board does not need to see detailed calculations. It is enough if they see that a certain amount of avoidable downtime or speed loss on a critical line represents a meaningful amount of profit left on the table, and that you have a practical plan to address it.
If you work in sectors like metal fabrication, it helps to adapt the language to that context. For example, you can focus on throughput per shift or tons per week instead of generic unit counts, as discussed in content such as this article on OEE for metal fabrication.
Many boards think of capacity in terms of new equipment or extra shifts. Your OEE presentation should show the capacity that is already hidden in existing assets and schedules. To do that, you can:
Use operational language that the board already knows. For example: “If we address the top three recurring stoppages on this line, we make room for more high-margin orders without extending the current shift pattern.” You still do not need to disclose internal financial figures, you only need to show clearly how technical losses link to commercial impact.
An OEE dashboard can show hundreds of reasons and micro-stops. The board does not need to see this level of detail. What they need is a clear focus on the small number of losses that matter most.
A simple structure for your board story:
That shortlist allows the board to discuss trade-offs and priorities, instead of getting lost in too many details.
When you show OEE data, visual choices matter. For board-level discussions, favor visuals that link directly to business outcomes:
These visuals shift the conversation away from abstract indices, and towards which classes of loss are big enough to warrant board-level attention, investment, or policy change.
The most important part of your board presentation is not the OEE number. It is the link between that number and the actions your team is taking. This is where a platform like Fabrico can strengthen your story.
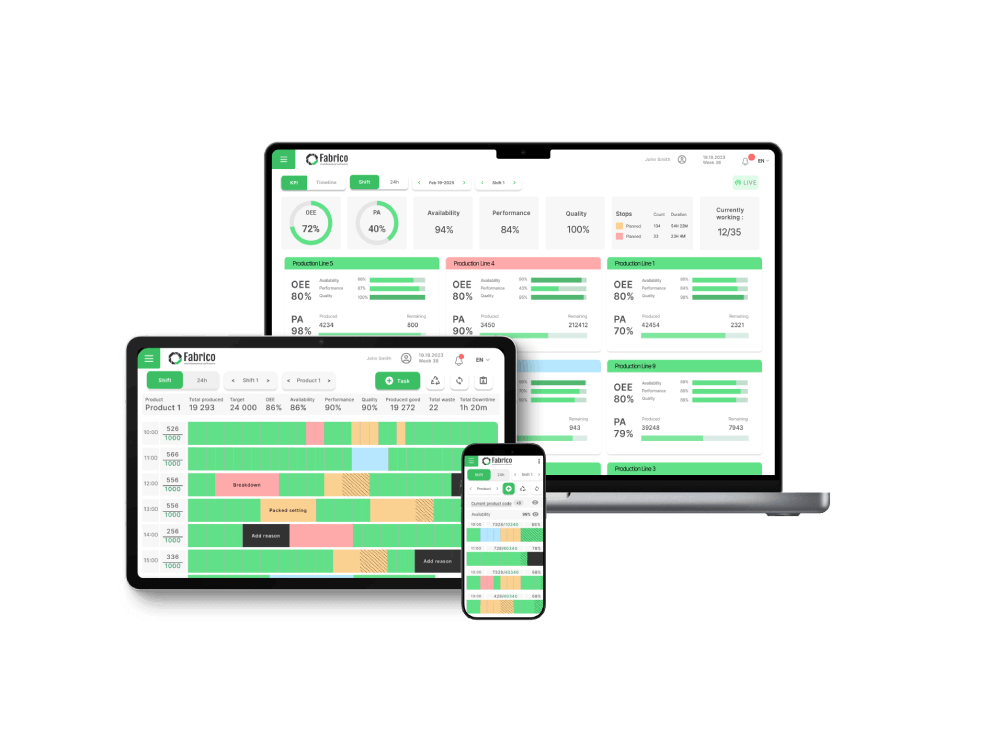
Fabrico is a cloud-based MES and OEE platform that captures production and downtime data straight from the machines, aggregates it into real-time OEE, and then turns each loss into specific actions for production and maintenance. Each time a loss occurs, operators can categorize it, and the platform can create tasks, trigger checks, or raise follow-ups that your teams can execute and close.
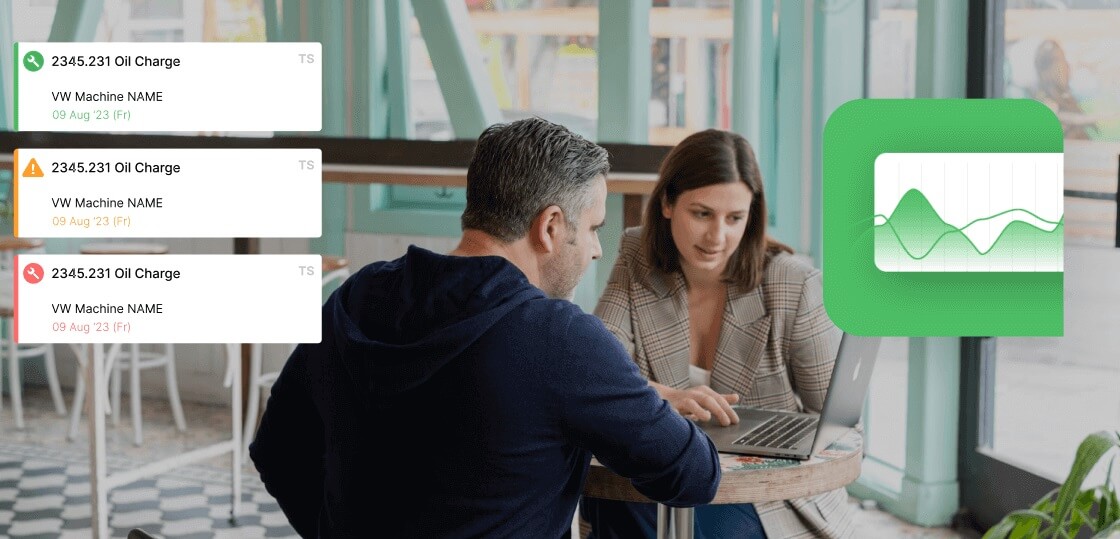
Because Fabrico has maintenance management built in as part of the platform, you can show how recurring equipment losses automatically become maintenance work, with clear ownership, priorities, and feedback into the production data. Instead of explaining to the board that “we have maintenance issues”, you can show how often specific assets cause stoppages, what tasks were raised, and whether those tasks reduced the recurrence of the issue.
To support your internal evaluation of tools, you can review analyses of OEE software such as the content at this article on choosing OEE software, then align solution features with the story you want to tell at board level.
One of the most practical uses of OEE at board level is to support or challenge capital and resource allocation decisions. You can use OEE and loss data to answer questions like:
Fabrico supports this by providing comparable data across lines and sites, with the same definitions and categories. That allows you to present a board-level view where, for example, two plants can be compared on similar terms: not just on their OEE figures, but on how their losses are distributed and how effectively they turn those losses into actions.
When you frame investment proposals, connect them to measurable changes in losses, and track progress using the same OEE and loss views you used to justify the investment in the first place.
During your presentation, avoid extended discussions about data collection methods, sensors, or technical settings unless the board asks for them. Instead:
Fabrico is built to support this type of story. It captures the data at source on the machines, presents OEE and losses in real time, and provides the tools to assign, track, and close both production and maintenance actions. That means you can move from “here is the data” to “here is what we did and what changed” in a single narrative.
To make your next board presentation on OEE concise and effective, you can structure it as follows:
This way, you respect the board’s time and attention, while still using OEE for what it is best at: making the current performance gap visible, and turning that gap into clear, manageable improvement actions.
Summarizing the role of Fabrico in this narrative:
This gives you a single environment to move from OEE metrics, to root cause analysis, to assigned actions, to verified results. That is the story that resonates at board level: clear visibility, clear accountability, and visible improvement in profit and capacity from the same assets.
If you want to see how this can look with your own lines and machines, you can Request a demo or Contact us to discuss your specific needs.
See how Fabrico unifies OEE and maintenance in one platform.
Request a demo




 Login
 Blog