Key takeaways
"What is a good OEE score?" is one of the most asked questions in manufacturing, and the honest answer has two parts: here is the common benchmark, and here is why your own trend matters more than it.
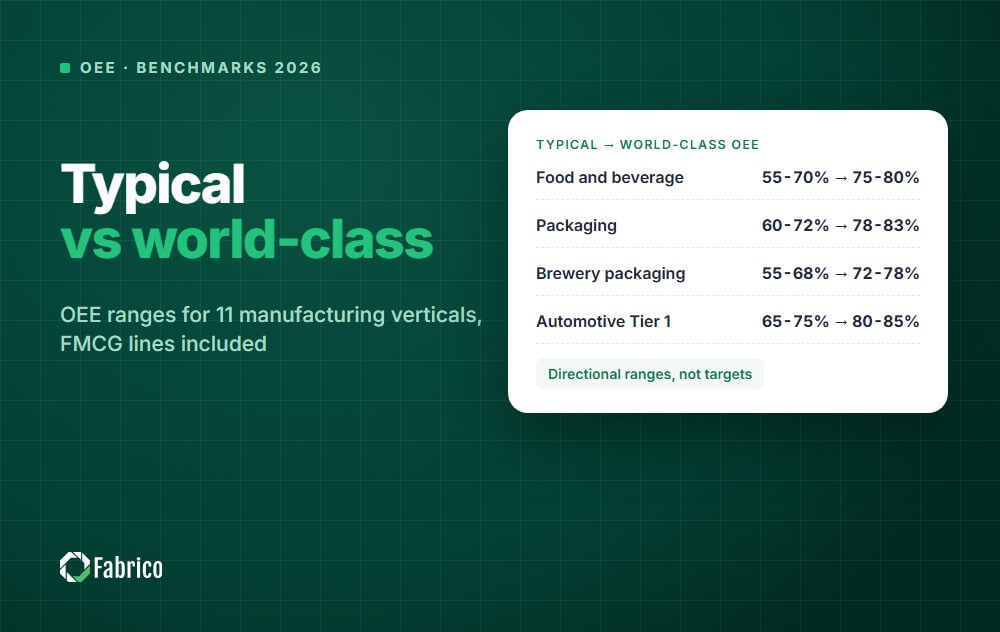
The widely used reference points are 85% as world-class and around 60% as typical for a discrete manufacturer. Many plants that have never measured properly are surprised to find their real number in the 40s or 50s once short stops are counted.
These figures are a useful sanity check, not a law. They came from discrete manufacturing and do not transfer cleanly to every process.
World-class OEE is the product of three strong but not perfect factors: about 90% availability, 95% performance, and 99% quality. Multiplied together, 0.90 times 0.95 times 0.99 gives roughly 0.85. The math shows why OEE is demanding: even good scores on each factor combine into a number well below 100%.
A "good" score is relative. A high-changeover, high-mix job shop will read lower than a long-run process plant, not because it is worse but because its work is harder to schedule. How a plant defines planned time and which losses it counts also swings the number by double digits, which is why cross-plant comparison needs shared definitions.
Two plants both report 75% OEE. One counts changeovers as downtime; the other excludes them. Put on the same definition, the second is really nearer 68%. Same headline, very different reality. The benchmark only means something when everyone measures the same way.
The most useful target is not a published benchmark but your own trend. Measuring real OEE honestly, then moving it up week over week, beats chasing 85% on paper. A plant that goes from 55% to 65% on true numbers has gained far more than one that reports 85% by ignoring its losses. Book a Fabrico demo to see honest OEE and the losses behind the number.
Around 85%, built from roughly 90% availability, 95% performance, and 99% quality. A typical discrete plant sits closer to 60%, and many measure lower once short stops are counted honestly.
Not necessarily. High-mix or high-changeover operations naturally read lower than long-run processes. A lower but honest number you are improving beats a high number that hides losses.
Key Takeaways: The "world-class 85% OEE" benchmark applies to one specific type of manufacturing. For most plants, this target is misleading, and chasing it drives wrong decisions. Fabrico helps you establish the right baseline for your process, then close the gap systematically.
What is a good OEE score? It depends entirely on your manufacturing process type.
The 85% benchmark comes from Nakajima's original TPM research, designed for high-volume, single-model discrete assembly. Applying it to food manufacturing, pharma, or job shops sets up your team to fail at a target that was never designed for them.
The actual world-class benchmarks by process type:
OEE benchmarks are useful for three things.
Setting improvement direction: If your automotive assembly line runs at 55% OEE while industry average is 65-75%, you have a documented improvement opportunity worth quantifying.
Identifying which loss category matters most: If your OEE availability is at benchmark but performance rate is 15 points below, the focus is speed and micro-stoppage reduction, not maintenance investment.
Acquisition due diligence: Comparing a target plant's OEE against sector benchmarks reveals operational improvement potential before purchase.
Where benchmarks get misused: applied as absolute targets regardless of product mix, maintenance philosophy, or process type. A pharmaceutical CMO at 45% OEE may be at world-class performance for their process. A high-volume automotive line at 65% OEE is significantly below benchmark for theirs.
The most useful OEE benchmark is your own historical performance, trending from your current baseline toward your operational potential for your specific process.
Knowing your OEE score and improving your OEE score are two completely different problems.
Most OEE platforms stop at the score. They give you 72% on a dashboard and leave you to figure out why.
Fabrico is built around the principle that OEE diagnoses, CMMS cures.
When Fabrico detects an OEE availability loss on a press line, it doesn't just log the event, it creates a CMMS work order automatically, assigns it based on asset criticality, and tracks whether OEE recovers after the maintenance action is completed.
That chain, from loss detection to maintenance execution to production recovery, is what turns an OEE score from a reporting number into an operational improvement engine.
The question isn't what's a good OEE score. The question is: what are you doing about the gap between your current score and your potential?
See how Fabrico unifies OEE and maintenance in one platform.
Request a demo











 Login
Login
 Blog
Blog