


 Login
 Blog
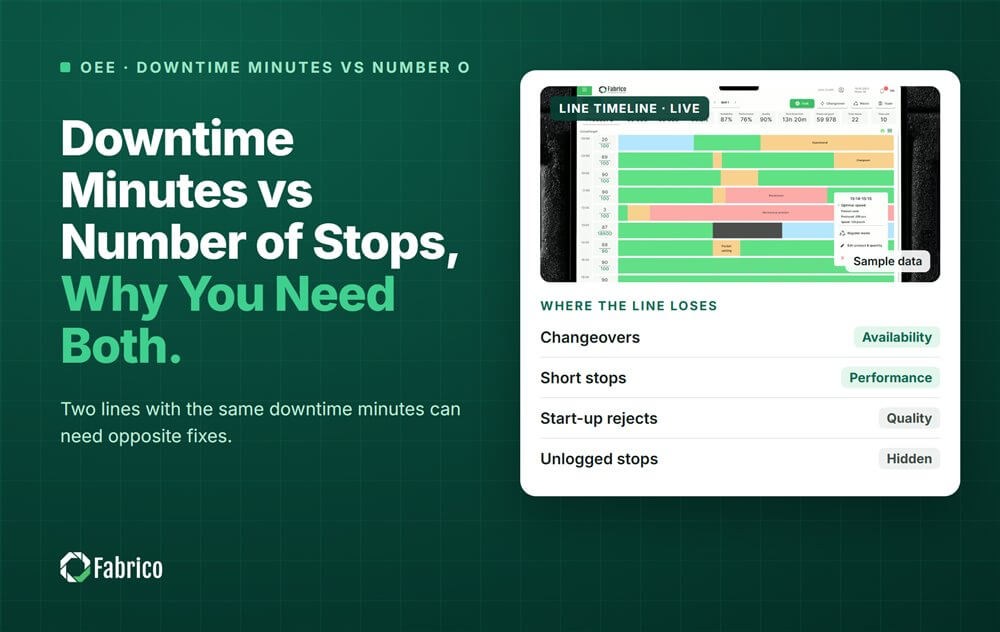
Downtime Minutes vs Number of Stops: Why You Need Both

Key takeaways
- Minutes alone hide whether you have a frequency problem or a duration problem.
- Average stop length = downtime minutes / number of stops.
- Mean time between stops = run time / number of stops.
- Every restart costs something extra: scrap, slow running, attention.
- Set one short stop threshold for the plant and keep it fixed.
Track both. Downtime minutes show how much time you lost; the number of stops shows how often the line was interrupted. A line with many short stops needs handling and settings fixes, while a line with a few long stops needs maintenance and faster response.
Fabrico, an OEE and light MES platform, logs each stop automatically, so the count and the minutes come from the same record, including stops too short for anyone to write down. This guide shows which stop metrics to track, why the same minutes can hide opposite problems, and how to show both on a shift board.
Why are downtime minutes not enough?
Downtime minutes are the number most plants report, and they matter: they are lost production time. But two lines with exactly the same minutes can be in very different trouble.
- One line stops sixty times for a minute each. The crew is busy all shift clearing jams.
- The other line stops four times for fifteen minutes each. The crew waits for a technician.
Same minutes, different causes, different owners, different fixes. And the first line also pays a restart cost sixty times: rejects at restart, slow running while the line settles, and an operator who never gets to do anything else. Our article on micro stops vs breakdowns covers why the small ones often cost more than they look.
Which stop metrics should you track?
| Metric | Formula | What it points to |
|---|---|---|
| Downtime minutes | Sum of stop durations | Lost production time |
| Number of stops | Count of stops | How often the line is interrupted |
| Average stop length | Downtime minutes / number of stops | Short stop problem or long stop problem |
| Stops per hour | Number of stops / run hours | Line stability, shift to shift |
| Mean time between stops | Run time / number of stops | How long the line runs without help |
| Short stop share | Stops under the threshold / total stops | How much the paper log is missing |
Mean time between stops is not the same as MTBF. MTBF, mean time between failures, counts only failures that need repair: total operating time divided by the number of failures. Mean time between stops counts each stop, including the jams an operator clears in seconds. Both are useful; they answer different questions. For the broader view of equipment downtime, see our equipment downtime guide.
Why do short stops and long stops need different fixes?
- Many short stops usually come from container handling, guide rails, settings, sensors and material quality. The fix is on the line: centerlines, rail adjustments, cleaner material, a better sensor position.
- Few long stops usually come from breakdowns, missing spare parts and waiting for a technician. The fix is in maintenance: response time, spare parts at the line, root cause analysis.
- Medium stops of five to ten minutes often hide changeover overruns, material runouts or quality holds. Give them their own codes.
What do two lines with the same downtime look like?
Sample lines (illustrative numbers, not a customer): two packaging lines on an 8 hour shift with 480 minutes of planned production time. Both report 60 minutes of downtime. Each restart scraps 20 units.
| Measure | Line A | Line B |
|---|---|---|
| Downtime minutes | 60 | 60 |
| Number of stops | 60 | 4 |
| Average stop length | 1 minute | 15 minutes |
| Run time | 420 minutes | 420 minutes |
| Mean time between stops | 7 minutes | 105 minutes |
| Restart scrap | 1,200 units | 80 units |
- Both lines have the same Availability on paper: 420 / 480 = 87.5%, if each stop is counted as downtime.
- Line A runs for 7 minutes, on average, before it needs help. Its crew clears a jam every few minutes all shift and scraps 60 x 20 = 1,200 units at restarts.
- Line B runs for 105 minutes between stops but then stands for a quarter of an hour, and scraps only 4 x 20 = 80 units.
- Line A's first move: find the two or three transfer points or settings behind most jams. Line B's first move: measure how much of each 15 minutes is waiting for a technician and how much is repair.
For comparison, a craft brewer packaging benchmark by OFS found a stop every 11 minutes 48 seconds on average. Frequent stops are normal on packaging lines; what matters is knowing which kind you have.
How do you set the short stop threshold?
No standard sets it. A minor stop is typically a minute or two, well under five minutes, and cleared by the operator without maintenance. The plant's cutoff decides whether a stop lands in Availability (as downtime) or in Performance (as a minor stop). OEE stays the same either way; the factor it lands in changes.
- Pick one threshold for the whole plant, for example 2 minutes.
- Write it down and use it on every line, so lines can be compared.
- Report short stops and long stops as two groups, each with count and minutes.
- Do not change the threshold to make a report look better. Changing it moves minutes from one bucket to another; the line does not get better.
Our guide to micro stops covers thresholds in more detail.
How do you show both on the shift board?
- Two rankings side by side: top reasons by count and top reasons by minutes, with cost next to both.
- Stops per hour as a trend, hour by hour, so the team sees when the line gets unstable (often after changeovers and shift changes).
- Average stop length per reason, so a reason that is getting longer stands out early.
- The short stop share, so you know how much the old paper log was missing.
Keep the board short. Three numbers per line and one ranking are enough for a daily meeting; the detail belongs in the weekly review. For more on where downtime comes from, see our unplanned downtime guide.
Where Fabrico fits
Fabrico is a computer vision enabled Manufacturing Performance Platform. OEE and light MES come first, with computer vision on stops.
- Automatic downtime logging, so stop count and minutes come from the same record.
- The operator confirms the reason in one tap, fast enough for frequent short stops.
- A camera clip as evidence for a stop, where a camera watches the station, so even a 30 second jam has a visible cause.
- Losses ranked by money, with count and minutes beside them.
- OEE live by line and shift, and one view across plants.
You start with a pilot on one line, with a baseline and a decision date agreed in advance. There is no free plan and there are no tiers: each plant gets a quote. See how short stops are captured on our computer vision OEE page.
Frequently asked questions
What is mean time between stops?
Run time divided by the number of stops. It tells you how long, on average, the line runs before it needs someone's help.
Is mean time between stops the same as MTBF?
No. MTBF counts only failures that need repair. Mean time between stops counts each stop, including short jams the operator clears.
Which matters more, stop frequency or stop duration?
Both. Frequency points to handling and settings problems; duration points to breakdowns and response time. Look at them together, with cost.
What counts as a short stop?
A stop cleared by the operator without maintenance, typically a minute or two. The plant sets the exact threshold, because no standard does.
How many stops per hour is normal?
There is no general figure; it depends on the line and the product. Compare each line with its own baseline and watch the trend.
See your stops by count and by minutes
Bring one line and last week's stop log. We will show both rankings and what each one cost.
Latest from our blog




Real Fabrico tiles, sample data.