


 Login
 Blog
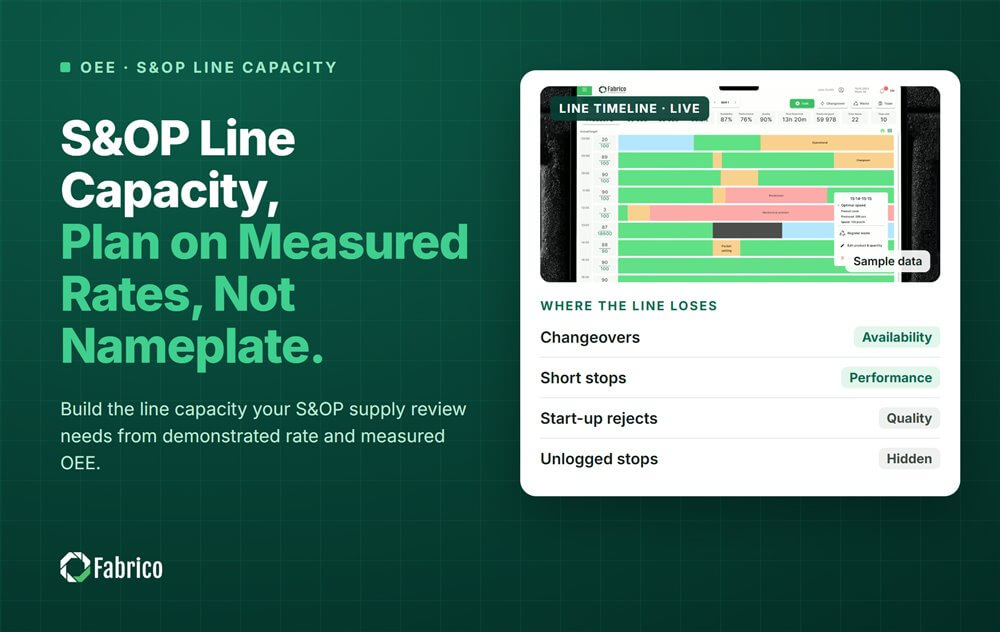
S&OP Line Capacity: Plan on Measured Rates, Not Nameplate

Key takeaways
- Line capacity for sales and operations planning should be measured good output in the hours the line will run, not nameplate speed times shift hours.
- Build it per line and product family: planned hours, minus changeovers for the mix, times rated speed, times measured OEE (overall equipment effectiveness).
- Nameplate is a ceiling. The gap to measured output is what a nameplate plan promises and then misses.
- Keep headroom at the bottleneck on purpose, and say how much in the review.
- Refresh the number every month from machine data, so improvements show up in the plan.
S&OP (sales and operations planning) line capacity is the good output a line can deliver in a month. Build it from demonstrated rate and measured OEE, after changeovers for the planned mix. Nameplate speed times shift hours is a ceiling, not a capacity. Plan on the ceiling and the supply review promises output the floor cannot make.
Picture the March supply review. The slide shows the dishwasher tablet line at nameplate speed on every shift. The line manager knows it has never come close, and says nothing, because the number came from the machine plate.
This guide is for COOs (chief operating officers), S&OP leads and plant managers in FMCG (fast-moving consumer goods) groups. They own the supply side of the plan. It covers the capacity number, how to build it, headroom and refresh. It comes from Fabrico, a platform for OEE and light MES (manufacturing execution system) with computer vision on stops.
What capacity number should go into S&OP?
Bring the measured good output each line can make in next month's real hours, by product family. Our guide to the S&OP cycle covers the meetings; this page covers only the capacity line in the supply review.
Three numbers sit behind it. Nameplate is rated speed times every shift hour in the month: the ceiling. Demonstrated is what the line really made. Plan capacity is demonstrated minus the headroom you hold back.
Our page on nameplate vs real capacity explains why the first two differ. Design capacity vs effective capacity has the textbook terms.
How do you build a line's monthly capacity from measured OEE?
Start from the hours the line is planned to run. Take out changeovers for the mix, then apply the rate it has shown it can hold. Do it per line and per product family.
- Count the planned hours in the month: shifts times days, minus planned stops such as deep cleans, planned work and holidays.
- Subtract changeover hours for next month's mix: the number of changeovers in the plan times your measured average per changeover.
- Multiply the hours left by the rated speed for that format.
- Multiply by measured OEE with changeovers taken out, because step 2 already counted them.
- Repeat per product family, since a small format and a large one do not run at the same speed.
Our guide to setting a demonstrated rate per SKU (stock keeping unit) explains how to pick a fair period and handle the spread.
Breakdowns sit inside measured OEE too. If a line fails more often each month, last quarter's figure is already too high. Our guide to failure rate vs MTBF (mean time between failures) shows how to read that trend.
Why does nameplate capacity break the S&OP plan?
Nameplate assumes no stops, no slow running, no rejects and no changeovers. No FMCG line runs like that, so a plan built on it is short before the month starts.
The gap does not vanish. It turns into one of these:
- Overtime and weekend runs to catch up, booked month after month.
- Late or short orders, and penalties where customer contracts have them.
- A request for a new line, when the hidden capacity is inside the old one.
Two more traps. Siemens' True Cost of Downtime 2024 found FMCG was the only sector whose downtime hours rose since 2019. Last year's rate can be too kind. The 85% often called world class comes from Nakajima's TPM (total productive maintenance) work (1984): Japan, the 1970s, automotive. Most plants score closer to 60%.
How much headroom should the plan keep?
Plan the bottleneck below its measured capacity, and state the gap in the review. A line loaded to its limit turns each small stop into a late order.
Kingman's queueing formula (1961) shows why: at the bottleneck, its utilization term is 4 at 80%, 9 at 90% and 19 at 95%. Waiting grows much faster than load near the limit.
- Decide headroom per line, in the open, at the executive review.
- Base it on the spread of measured months. A line with steady months needs less than one with wild swings.
- Give headroom back to the plan as the measured rate rises.
How often should you refresh the capacity number?
Every month, before the supply review, from the latest machine data. Capacity is a measurement, and it moves when losses are fixed or new ones appear.
- Flag any line whose measured OEE moved since last month, and say why.
- Use the same OEE definitions at every plant, or group S&OP compares rules, not lines.
- Show load against measured capacity. Our guide to the capacity utilization rate covers the formula.
A worked example: March capacity on a dishwasher tablet line
Sample line (illustrative numbers, not a customer): a dishwasher tablet press and packing line, rated at 600 tablets a minute, or 36,000 an hour. It runs two 8 hour shifts on 20 working days in March. The demand plan asks this product family for 7,300,000 tablets.
| Step | Nameplate view | Measured view |
|---|---|---|
| Hours in March, 2 shifts x 8 h x 20 days | 320 | 320 |
| Planned deep cleans and planned work, hours | 0 | 20 |
| Changeovers in the plan, 20 x 36 minutes, hours | 0 | 12 |
| Run hours | 320 | 288 |
| Good tablets an hour | 36,000 | 36,000 x 62.5% = 22,500 |
| March capacity, tablets | 11,520,000 | 6,480,000 |
| Plan capacity, 5% headroom held back | not used | 6,156,000 |
| Demand plan, tablets | 7,300,000 | 7,300,000 |
| Load on the line | 63.4% | 112.7% of measured, 118.6% of plan |
- Run hours = 320 minus 20 minus 12 = 288.
- Measured OEE with changeovers taken out is 62.5%, so the line makes 36,000 x 0.625 = 22,500 good tablets an hour.
- Measured capacity = 288 x 22,500 = 6,480,000 tablets. Nameplate says 320 x 36,000 = 11,520,000.
- On nameplate the family loads the line to 7,300,000 / 11,520,000 = 63.4%. It looks like room to spare.
- On measured capacity the load is 7,300,000 / 6,480,000 = 112.7%. The line is short by 7,300,000 minus 6,480,000 = 820,000 tablets.
- With 5% headroom held back at the bottleneck, plan capacity is 6,480,000 x 0.95 = 6,156,000 tablets.
- Against plan capacity, the load is 7,300,000 / 6,156,000 = 118.6%.
- Closing the gap to measured capacity takes 820,000 / 22,500 = 36.4 extra run hours, four or five Saturday shifts.
- At a contribution of $0.09 a tablet, the shortfall puts 820,000 x $0.09 = $73,800 of margin at risk.
- In a euro plant at €0.09 a tablet, that is €73,800.
The nameplate view tells the review all is well. The measured view gives a real choice: find 36 hours or more, fix losses, move volume to a sister plant, or change the demand. That choice is what S&OP is for, and nameplate hides it.
Mistakes plants make with S&OP capacity
- Nameplate speed times shift hours in the supply review.
- One rate for the whole line, when each format runs at its own speed.
- No changeover hours, so a mix with more short runs looks free.
- Last year's OEE, never refreshed, on a line that has changed.
- Headroom hidden in low planning rates instead of stated in the review.
- Plants on different OEE definitions, so group capacity cannot be added up.
Where Fabrico fits
Fabrico is a computer vision enabled Manufacturing Performance Platform. OEE and light MES come first: it measures what each line really makes, so the capacity in the supply review comes from machine data. S&OP itself stays in your planning process.
- OEE live by line and shift, so next month's rate is based on this month, not last year.
- Automatic downtime logging, so short stops and changeover overruns sit inside the capacity number.
- Losses ranked by money, so the gap to nameplate has a price and a first fix.
- One view across plants, so group S&OP compares lines on the same definitions.
You start on one line, with a baseline and a decision date agreed in advance. There is no free plan and there are no tiers: each plant gets a quote. Book a demo to see measured capacity on one of your lines.
Frequently asked questions
What is capacity planning in S&OP?
It is the supply side of the monthly plan. Operations states how much each line or plant can make in the coming months, by product family. Leadership then compares that with demand and decides how to close any gap. The number only helps if it comes from measured output, not nameplate speed or a hoped-for rate.
Should S&OP use nameplate or demonstrated capacity?
Use demonstrated capacity: the good output the line has really delivered per hour, with changeovers for next month's mix taken out separately. Nameplate is a ceiling that no line reaches. Keep it on the page as the target for improvement work, but never let it set the volume you promise customers.
How do changeovers affect S&OP capacity?
Each changeover takes run hours out of the month. A mix with many short runs costs more hours than one with a few long runs, even at the same volume. Count the changeovers in next month's plan, multiply by your measured average time, and subtract those hours before you apply the rate.
What is the difference between S&OP capacity and rough-cut capacity planning?
S&OP capacity is the monthly check by product family: can the lines make the agreed volume? Rough-cut capacity planning comes next. It tests the master production schedule against the key machines, usually week by week. Both need the same measured rates. Our guide to rough-cut capacity planning covers the method.
See your lines' real capacity in a demo
Bring one line and last month's output. We will show its measured rate, its losses and the gap to nameplate, in hours and money.
Latest from our blog







Real Fabrico tiles, sample data.