


 Login
 Blog

Light MES for Plant Groups With Different ERPs: What to Share

Key takeaways
- Plants on different ERP (enterprise resource planning) systems can measure OEE (overall equipment effectiveness) one way.
- A light MES (manufacturing execution system) works at Level 2 to 3, below each ERP, so no ERP has to change.
- Share the definitions, the loss codes and one view across plants; keep material numbers, costing and the month-end close local.
- Map local product codes and count units at the line, so every plant's OEE uses the same rules.
- Do not wait for an ERP harmonization program to start measuring.
Yes, a group whose plants run different ERPs can share one way of measuring OEE. OEE is built from machine time and counts at Level 2 to 3, below the ERP. So each plant keeps its own ERP for orders and costing, and the group shares the definitions, the loss codes and one view across plants.
The weekly group call. The Spanish plant reports output in cases from one ERP, the Polish plant in bottles from another, the Czech plant in pallets from a third. The chief operating officer asks which line lost the most last week. Nobody can answer before Thursday.
This guide is for chief operating officers, operational excellence leads and IT (information technology) leads in groups with more than one ERP. It covers what to share, what stays local, product codes and units, and a worked example. This guide comes from Fabrico, a platform for OEE and light MES with computer vision on stops.
Can plants with different ERPs share one way of measuring OEE?
Yes, because OEE does not live in the ERP. ISA-95, the standard for linking business and plant systems, puts ERP at Level 4, working in months, weeks and days.
It puts MES at Level 3, working in days, shifts, hours, minutes and seconds. A stop on a filler lasts seconds or minutes; the ERP sees the order later, as a total. That is why one light MES layer can sit under three different ERPs.
Our guide to ERP vs MES covers the basic split, and our ISA-95 guide explains the levels.
What does the group share, and what stays local?
Share what makes OEE comparable. Keep local what each ERP already runs.
| Shared across the group | Stays local in each ERP |
|---|---|
| One product family per format | Material numbers |
| OEE counted in the unit the machine makes | Each ERP's own units: cases, bottles or pallets |
| Losses priced with each controller's contribution per unit | Costing |
| OEE by line and shift, every day | The month-end close |
The OEE definitions and loss codes are shared too; our guide to the OEE report for head office lists them. Smaller plants can run the same layer with a small team, as our guide to lightweight MES for small manufacturers shows.
Why should OEE not wait for one ERP?
Because ERP harmonization takes years, and the losses on the lines happen every shift.
An industry survey of 1,560 decision makers in 17 countries found integration is the top MES buying requirement, named by 44%. Three ERPs make that harder.
So start the OEE layer on its own, then agree with IT, plant by plant, which summary each ERP needs. ERP works in days and weeks, so it needs a summary, not raw machine signals.
A first summary can be good and scrap quantity, run hours and downtime by loss group. Our guide to connecting OEE and ERP without a heavy IT project covers that first link.
How do product codes and count units line up across ERPs?
Map them once, at the line. Each line keeps a short table: the local product code, the format, the units per pack and the rated speed for that format.
- Product codes. The same bottle can carry one material number in one ERP and another code in the next. Both point to one product family.
- Count units. Convert with the pack count of the running format, never with a monthly average.
- Rated speed. Set it per format at the line, from the machine. Never import an ERP routing rate as the ideal.
- Shift calendars. Planned time comes from each plant's own calendar, under the group's rules.
Our guide to rolling OEE up across sites covers how to add plants up from minutes and counts.
A worked example: three plants, three ERPs, one OEE view
Sample line (illustrative numbers, not a customer): a group fills shampoo bottles on one line in each of three plants. Each plant runs a different ERP and counts in its own unit. Each line had 420 planned minutes in the shift.
| Plant | ERP counts in | Good output (local unit) | Good bottles | Rated speed, bottles a minute | Contribution a bottle |
|---|---|---|---|---|---|
| Plant A | Cases of 12 | 3,450 cases | 41,400 | 120 | $0.22 |
| Plant B | Bottles | 33,300 bottles | 33,300 | 100 | $0.28 |
| Plant C | Cases of 6 | 8,550 cases | 51,300 | 150 | $0.31 |
- Plant A: 3,450 x 12 = 41,400 bottles. OEE = 41,400 / 120 / 420 = 345 / 420 = 82.1%.
- Plant B: OEE = 33,300 / 100 / 420 = 333 / 420 = 79.3%.
- Plant C: 8,550 x 6 = 51,300 bottles. OEE = 51,300 / 150 / 420 = 342 / 420 = 81.4%.
- Lost bottles: A 50,400 minus 41,400 = 9,000; B 42,000 minus 33,300 = 8,700; C 63,000 minus 51,300 = 11,700.
- Lost margin a shift, if the output would have sold: A 9,000 x $0.22 = $1,980.
- B 8,700 x $0.28 = $2,436, and C 11,700 x $0.31 = $3,627.
- In a euro plant the same figures read in euros: Plant B loses €2,436 a shift at €0.28 a bottle.
Read in local units, the weekly call compares 3,450 cases, 33,300 bottles and 8,550 cases. Plant B looks like the biggest producer and Plant A the smallest.
Converted at the line, Plant C makes the most bottles and Plant B the fewest. No ERP changed: each line needed only a pack count and a rated speed per format.
Mistakes groups make with OEE across different ERPs
- Waiting for one ERP before measuring a single line.
- Taking the ideal rate from each ERP's routing, so each plant has its own idea of fast.
- Comparing plants in their local units, cases against bottles.
- Averaging plant OEE percentages instead of adding up minutes and counts.
- Asking for live two-way links to every ERP before the first line runs.
Where Fabrico fits
Fabrico is a computer vision enabled Manufacturing Performance Platform. OEE and light MES come first. In its own words, Fabrico "operates squarely in the Level 2 to Level 3 space". It "is not an ERP and does not replace Level 4".
- One view across plants, whatever ERP each plant runs.
- OEE live by line and shift, on group definitions set once.
- Automatic downtime logging from the machine signal in each plant.
- Every loss priced in money, with each controller's contribution per unit.
You start on one line, with a baseline and a decision date agreed in advance. There is no free plan and there are no tiers: each plant gets a quote. Questions about a link to a particular ERP go to our technical team, plant by plant. Our guide to light MES explains the approach.
Frequently asked questions
What happens to OEE when a plant changes its ERP?
Very little, if OEE lives in the MES layer. The definitions, the loss codes and the machine data stay where they are. Only the product code mapping and the summary sent to the new ERP need updating. That is one more reason to keep OEE off the critical path of an ERP migration.
Do we need to harmonize our ERPs before measuring OEE?
No. OEE comes from machine time and counts, which live below the ERP. Measuring OEE the same way in every plant needs shared definitions and loss codes, not a shared ERP. ERP harmonization can follow its own timeline without holding the lines back.
What data should go from the MES to each ERP?
Usually a short summary, not the stop detail. ERP works in days and weeks, so it needs a summary, not raw machine signals. Good and scrap quantity, run hours and downtime by loss group are a common start. Single stops and their reasons stay in the MES layer, where the line team uses them.
How do you compare plants that count in different units?
Count OEE in the unit each machine makes, then convert with the pack count of the running format for the group view. Set the rated speed per format at the line. Then compare lost output in one unit, and in money, rather than local reports in cases, bottles and pallets.
Who owns the OEE definitions in a multi-ERP group?
The group operational excellence lead owns the definitions and the loss code list. Each plant manager owns the line data, and each controller owns the contribution per unit used to price losses. IT owns the connections. Write the owners down before the first plant goes live, so a rule change has one place to go.
See plants on different ERPs in one view
Bring one line from each of two plants on different ERPs. We will show both on the same OEE rules, in one unit and one currency.
Latest from our blog

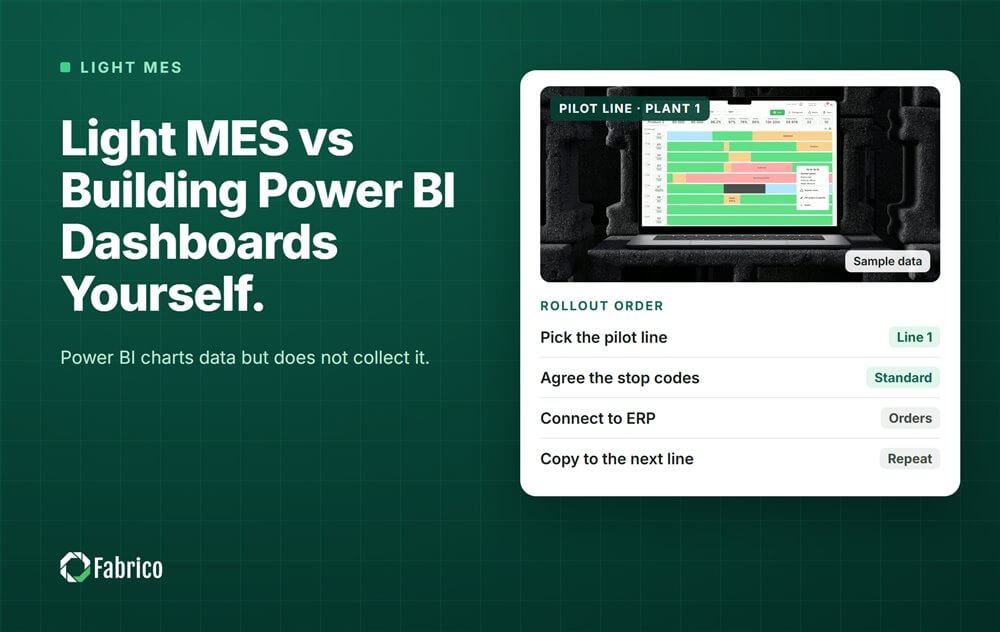


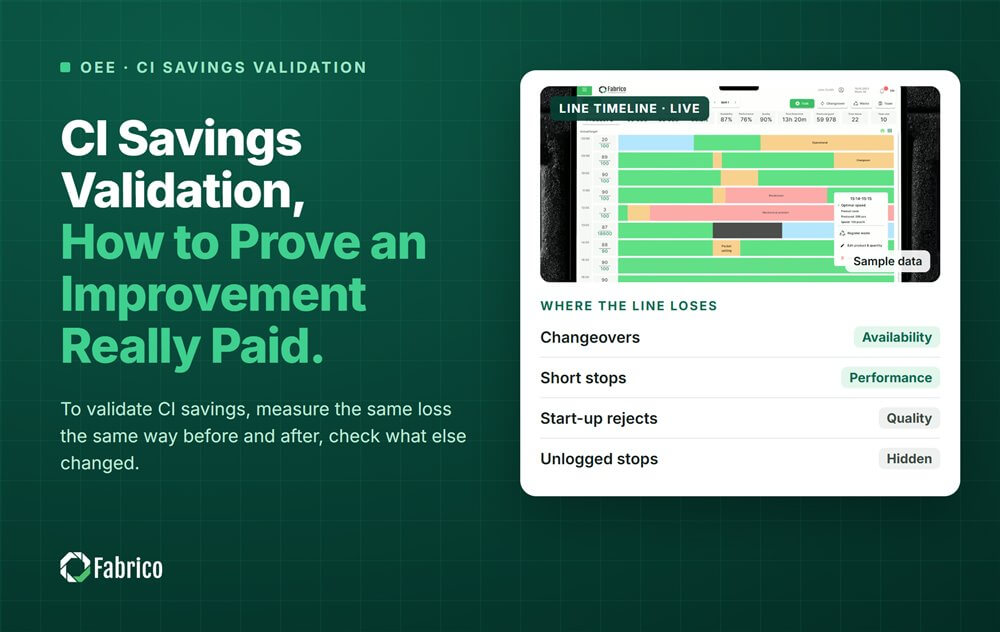
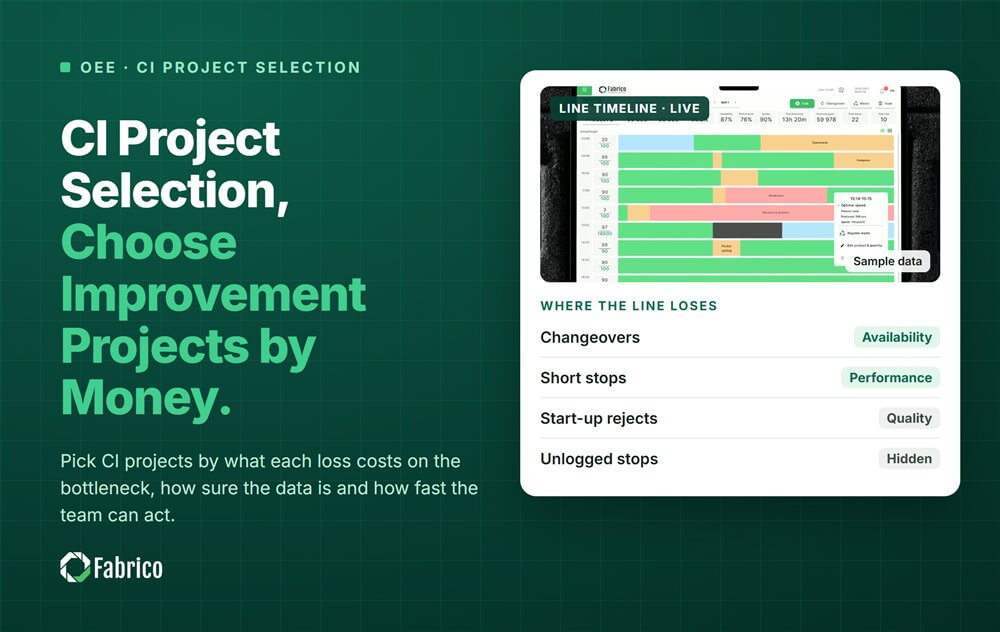


Real Fabrico tiles, sample data.