


 Login
 Blog
European Gas Passed €100/MWh in October: What It Means for Factory Energy Costs

News, 11 November 2026. Every news figure below comes from a linked source, and the full list is at the end. Prices move daily; check a live source before you act.
In short: Europe's benchmark gas price passed €100 per MWh on 28 October 2026 for the first time since December 2022. The same day, day-ahead power for Romania cost €311 per MWh, with Bulgaria and Hungary also above €300.
- A factory pays for every kWh its equipment draws, whether the line makes good product, idles or makes scrap.
- So when prices rise, energy per good unit becomes a cost line to manage, and OEE losses become energy losses.
- Below: what happened, what it means for plants, a worked example, and three steps that need no new equipment.
What happened in late October and early November 2026
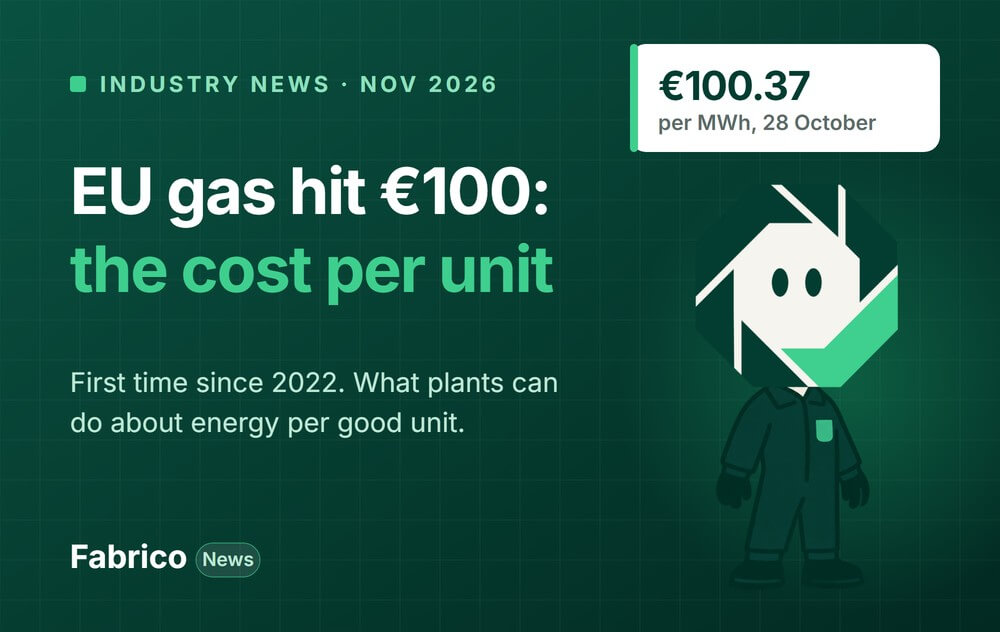
On 28 October 2026, the Dutch TTF front-month gas contract traded at €100.37 per MWh at 16:00 CET, up more than 4% on the day, Euronews reported. It was the first time above €100 since December 2022. Before the Iran war began in late February 2026, the price was around €32.
Euronews linked the rise to disrupted LNG shipments, mainly from Qatar, and to low storage. EU Energy Commissioner Dan Jørgensen said: "Once again, due to geopolitical turbulence, Europe faces another energy crisis."
Prices have eased a little since. On 9 November, European gas was above €86 per MWh, near a two-week low, Trading Economics reported. EU storage was 72.65% full on 8 November, against a five-year seasonal average of 90%.
Power prices rose in South-East Europe too. For delivery on 28 October, Romania's day-ahead price was 1,664 lei, or €311, per MWh, the highest in Europe, Economica.net reported on 27 October. Bulgaria and Hungary were also above €300.
On 6 November, energy ministers from the region met the Commission in Zagreb. The Commission's summary notes "persistently high energy prices in the region" and talks of keeping businesses competitive. It names no new support measure.
For context, Eurostat reported on 4 November that EU electricity for non-household users averaged €0.18 per kWh in the first half of 2026 (500 to 2,000 MWh a year), down 5.4% on a year earlier. Bulgaria rose 14.2%, one of the three largest increases. Those figures are from before the autumn rise.
What it means for plants
An oven, a fryer, a chiller or a compressor draws power while it is on, not only while it makes good product. A line that stops for 20 minutes with the oven hot still pays for those 20 minutes.
So every OEE loss has an energy cost: stops with equipment on, slow running, and rejects that used the full energy of a good unit. When the price per kWh rises, the cost of those losses rises with it.
This article gives no advice on tariffs, hedging or state aid. Those depend on your contract and your country. What a plant can control is how much energy each good unit takes.
Energy per good unit: a worked example
Example data. A biscuit line with an electric oven draws about 250 kW whenever it is on, running or stopped. An 8-hour shift uses 2,000 kWh. The line is rated at 100 packs a minute, so 48,000 packs a shift at 100% OEE.
| Line OEE | Good packs | kWh per 1,000 packs | Energy cost per 1,000 packs at €0.18/kWh |
|---|---|---|---|
| 60% | 28,800 | 69.4 | €12.50 |
| 70% | 33,600 | 59.5 | €10.71 |
Same energy, 17% more good packs, so 14% less energy in each pack. €0.18 is Eurostat's first-half average for one consumption band, used only to show the math; use your own tariff. In practice, part of a line's load does drop when it stops, so measure your own split.
Three steps that need no new equipment
- Put a meter reading next to each shift. Log kWh (and gas, if you can) per line and shift for the big users: ovens, fryers, chillers, compressors. That is your baseline. Our guide to energy baselines and EnPIs sets one up.
- Divide by good units, not by hours. kWh per good unit, per line and shift, shows which shifts and products waste the most. See specific energy consumption.
- Agree a stop rule for long stops. Decide which equipment goes to standby after how many minutes, and log each long stop with its reason, so the rule is used. More in standby and idle energy losses and cutting idle-time energy waste.
Where OEE, cameras and light MES help
OEE tells you how much of the planned time made good product. Next to an energy meter, it splits the bill into energy that made sellable output and energy that did not.
A light MES records each stop with its start, end and reason, so a long stop with the oven hot shows up as a named loss with an owner, not as a vague line on the bill.
Where a station has no machine count, an AI camera (an add-on) that counts output gives the units side of the ratio, and rejects logged at the line make it good units. Without a count, energy per unit is a guess.
How Fabrico does it
Fabrico is a cloud OEE and light MES platform. It shows run, stop and slow time and output counts per line and shift from the machine signal. Where there is no signal, AI cameras (an add-on) count output. Operators add the stop reasons. Fabrico does not meter energy itself. Data leaves through Excel or CSV export or the REST API, so you can divide your own meter readings by good units in your energy sheet.
Want to see energy per good unit on one line? Book a demo and bring a week of its meter readings.
What people ask next
Why did European gas pass €100/MWh in October 2026?
Euronews reported on 28 October 2026 that disrupted LNG shipments from the Iran war, mainly from Qatar, and low EU gas storage pushed the TTF front-month contract to €100.37 per MWh, the first time above €100 since December 2022.
What is the European gas price now?
We do not track live prices. Trading Economics reported European gas above €86 per MWh on 9 November 2026, near a two-week low. Check a live market source before any decision.
How can a factory cut energy cost per unit without new equipment?
Log energy per line and shift, divide it by good units rather than hours, and agree a standby rule for long stops. Raising OEE also lowers energy per unit when much of the load runs whether or not the line makes good product.
Sources
Checked on 11 November 2026. Dates are the publication dates shown on each page.
- Euronews, European gas price crosses €100 for first time since 2022 as EU warns of new crisis, 28 October 2026
- Trading Economics, European Gas Prices Remain Near 2-Week Low, 9 November 2026
- Economica.net, Romania day-ahead power price for 28 October (in Romanian), 27 October 2026
- European Commission, CESEC Ministerial takes stock of cross-border energy infrastructure and prices, 6 November 2026
- Eurostat, Non-household electricity prices fall further in 2026, 4 November 2026
Related articles





Latest from our blog








Real Fabrico tiles, sample data.