


 Login
 Blog
OEE for Seafood Processing: Fish Lines, Yield and Waiting for Fish

In short: OEE on a seafood line is measured in good packs at the end of the line, against the time you planned to run. Fillet yield is a second number and stays out of OEE.
- Count good packs after the tray sealer or vacuum packer, with one ideal rate per product and size grade.
- Waiting for fish gets its own stop reason. It is not a machine fault.
- A clean inside a production shift is an availability loss. A sanitation shift with no production planned sits outside OEE.
- Hand trimming usually sets the pace, so agree the crew that the ideal rate assumes.
- Where no PLC gives a count, use a pack signal, a sensor or a camera that counts parts.
A fish line is not a bottling line. The raw material arrives when the boat or the truck does, no two fish are the same size, and the slowest step is often a row of people with knives.
That is why a generic OEE setup gives a seafood plant numbers nobody trusts.
This page shows how to set up OEE on a fish or seafood processing line, what to count and where, and what to ask a software vendor. We sell Fabrico, so test what we say like any other vendor's claims.
A fish line step by step, and where each step loses
Most whitefish and salmon lines run in the same order, from reception or thawing to a sealed pack. Shellfish lines swap the middle steps for cooking and peeling, but the logic holds.
Three things set this line apart from a normal packing line.
- Supply: the line can be crewed and ready with no fish to run.
- Pace: the slowest step is manual, so speed depends on the crew and on the fish.
- Product: it is lost two ways, as rejected packs and as flesh that never reaches a pack.
Each one needs a written rule before the first number goes on a screen.
Fillet yield stays out of OEE quality
OEE quality asks one thing: of the packs that reached the counting point, how many were good? Leaking seals, short weights, a bone found at the check and wrong labels are quality losses.
Yield asks something else: of the kilos of fish that came in, how many went out as product? Heads, guts, frames, skin and trim belong to yield, not to OEE.
Keep them apart for a practical reason. Yield moves with the fish, and OEE should move with the line.
The FAO's survey of fish yields puts it plainly: "Yield measurements are particularly variable". It adds that published yields for one species can differ by a factor of 2.
Put that swing inside OEE quality and a batch of small, soft fish looks like a bad shift. Our page on OEE vs yield sets the two formulas side by side.
Track yield next to OEE, by batch, supplier and size grade. Do the same with overweight packs and heavy glaze: they pass as good packs, so they are giveaway, a loss of its own outside the quality rate.
Waiting for fish is not a machine stop
On a seafood line, an empty infeed is often the top reason to stand still. The landing was short, the truck was late, thawing ran behind, or grading could not keep up.
There are three cases, and each has its own rule.
- No fish, so no shift was planned: the time is outside planned production time, and outside OEE. It shows in TEEP, which measures against all calendar time.
- Shift planned and crewed, fish late: an availability loss with its own reason, such as "waiting for raw material". It belongs to supply or to the step upstream, not to the filleting machine.
- Short gaps on the belt: seconds between totes or tubs. They show as slow running or as micro-stops, and they add up.
The test for any setup: can the report split "the machine stopped itself" from "the machine was starved"?
If both land in one bucket, maintenance gets blamed for the weather at sea.
Hand trimming sets the pace: how to set the ideal rate
A filleting machine has a rated speed in fish per minute. The trimming and bone check tables after it do not, and they usually decide how many packs leave the line.
So set the ideal rate at the end of the line, in good packs per minute, for one product and one size grade at a time. Large cod cut into loins does not share a rate with small haddock fillets on the same line.
Take the rate from the best sustained hour you have recorded on that product, not from the budget. The method is in our guide to OEE calculation.
Then write down the crew that rate assumes. If it assumes ten trimmers and eight turn up, you have two honest options.
- Keep the rate. The shortfall shows as a performance loss with the reason "short crew".
- Use a second, agreed rate for the smaller crew. OEE then judges the line only, and the labour gap is reported somewhere else.
Either works. Switching between them from week to week does not.
Clean-downs on a fish line: where the minutes sit
Fish plants clean often, and the plant's own food safety plan sets how and for how long.
OEE does not argue with that. It only needs to know where the minutes sit.
- Sanitation shift with no production planned: outside OEE, inside TEEP.
- Clean-down inside a production shift, for example between a shellfish run and a fish run: an availability loss with its own reason code.
Time the whole window, from the last good pack before the clean to the first good pack after it. A freezer defrost inside the shift follows the same rule.
The wash itself is fixed. The minutes that come back are in the waiting, the strip-down and the restart around it.
Our page on sanitation shifts in OEE and TEEP has the full convention. Whatever you choose, use it on all lines.
Where to count when there is no usable PLC count
Older heading and filleting machines often give a run signal and nothing else. Manual tables give no signal at all.
You still need two facts: is the line running, and how many good packs came off it?
| Step | What it usually gives | How to use it |
|---|---|---|
| Grader or batching scale | Pieces and kilos by grade, if it has a data port | The kilos-in figure for yield, not for OEE |
| Heading, filleting, skinning | Run signal, sometimes a cycle count | Stops come from the signal. A cycle is a fish, not a pack. |
| Trimming and bone check tables | Nothing | A sensor or a camera that counts parts on the outfeed belt |
| Freezer or glazer | Belt running, temperature | Stops only |
| Checkweigher | Accepted and rejected packs | Good and reject counts, if you can read them out |
| Tray sealer or vacuum packer | A cycle signal | Cycles times packs per cycle gives total packs |
A plain photo-eye struggles with wet fillets that touch or overlap on a belt. It does better on sealed trays, where there is a gap between packs.
A camera that counts parts earns its place over a belt of loose portions, or where one line runs several tray formats. Ask the vendor to show the count on your own product, wet and glazed, before you rely on it.
Pick one counting point for OEE and keep it. Packs after the sealer is the usual choice, because that is what you sell.
Worked example: one shift on a cod portion line
This is example data with round numbers, describing no real plant.
The line packs chilled cod portions in 250 g trays, at an ideal rate of 20 trays a minute. The ideal cycle time is 0.05 minutes a tray.
The shift has 480 planned minutes after breaks. The line stood still for 96 of them.
- Waiting for fish: 36 minutes
- Clean-down between two runs: 24 minutes
- Tray sealer, film change and seal faults: 20 minutes
- Filleting machine, jam and knife change: 16 minutes
The sealer made 6,400 trays. 160 were rejected for leaks, short weight or a bone found at the check, which leaves 6,240 good trays.
| Factor | Sum (example) | Result |
|---|---|---|
| Availability | 384 run minutes of 480 planned | 80% |
| Performance | 6,400 trays of 7,680 possible (384 x 20) | 83.3% |
| Quality | 6,240 good trays of 6,400 | 97.5% |
| OEE | 0.80 x 0.833 x 0.975 | 65% |
Now the check: 6,240 good trays x 0.05 minutes is 312 minutes of good output, and 312 of 480 is 65%. Both routes agree.
Then the yield. Say 3,120 kg of headed and gutted cod went in and 1,560 kg came out in good trays: a 50% yield.
That 50% says nothing about the 96 stopped minutes, and the 65% says nothing about the trim. You need both.
The biggest single loss in this shift is 64 minutes of slow running. In the example it came from a short trimming crew and gaps on the infeed belt, not from a machine.
What to check in OEE software for a seafood line
Run these in the demo with any vendor, including us. Bring one real shift.
- Starved or stopped: can a stop be logged as "waiting for fish" and kept apart from machine faults in the report?
- Rates by product: can each product and size grade have its own ideal rate, and who is allowed to change it?
- Crew: ask how a short trimming crew shows. Is it a reason on slow running, or nowhere?
- Cleaning: log a clean-down inside a shift and a sanitation shift outside it. Check that each lands where your rule says.
- Counting with no PLC: ask how packs are counted at a sealer with only a cycle signal, and at a manual table with none.
- Wet area: ask where the tablet or phone sits in a washdown zone, and how an operator in gloves picks a reason.
- Yield beside OEE: ask if kilos in and kilos out can sit next to OEE, or if the data leaves by export to your yield sheet.
For a wider comparison, see our reviews of OEE software and downtime tracking software.
Where Fabrico fits
Fabrico is a cloud-based OEE and light MES platform, on the web, iOS and Android.
- Stops: they come from the machine signal, through the PLC or a Fabrico IoT device. The operator adds the reason on a tablet or phone.
- OEE and downtime: availability, performance and quality, by line and by shift. Micro-stops are detected from the machine signal.
- Money: losses can be shown in money, not only in minutes.
- Counting: the AI camera is an add-on that counts parts. You can open the video of a stop. In the standard setup, video is streamed, not stored.
- Your data: REST API and webhooks, and any list exports to Excel or CSV.
- Maintenance: a stop reason can be set up to open a maintenance task.
- Not in Fabrico today: production planning and scheduling.
Two things to see on your own line, not on a slide: "waiting for fish" as a reason, and the camera count on wet, loose portions. Ask us to show both, and ask how your yield figures would sit beside OEE.
What people ask next
What is a good OEE for a seafood processing line?
We know of no sourced benchmark that holds across species, products and plants, so we give none. Compare the line with itself, week on week, with rules that do not change.
Should fillet yield be part of OEE quality?
No, OEE quality counts good packs against all packs at one counting point. Yield is kilos out against kilos in, and it belongs next to OEE, by batch and supplier.
Does waiting for fish count against OEE?
It does when the shift was planned and crewed: log it as an availability loss with its own reason, apart from machine faults. If no shift was planned, the time is outside OEE.
Should OEE on a fish line be in kilos or in packs?
Use packs where the pack weight is fixed, and kilos for bulk product such as frozen blocks. Pick one unit per line, and set the ideal rate in that same unit.
How do we count at a manual trimming table?
Count what leaves it, not what people do. A sensor or a camera that counts parts on the outfeed belt can do it, or you count packs at the sealer and treat the table as part of the line.
Want to run these checks on your own line? Book a demo or Contact us.
Related articles
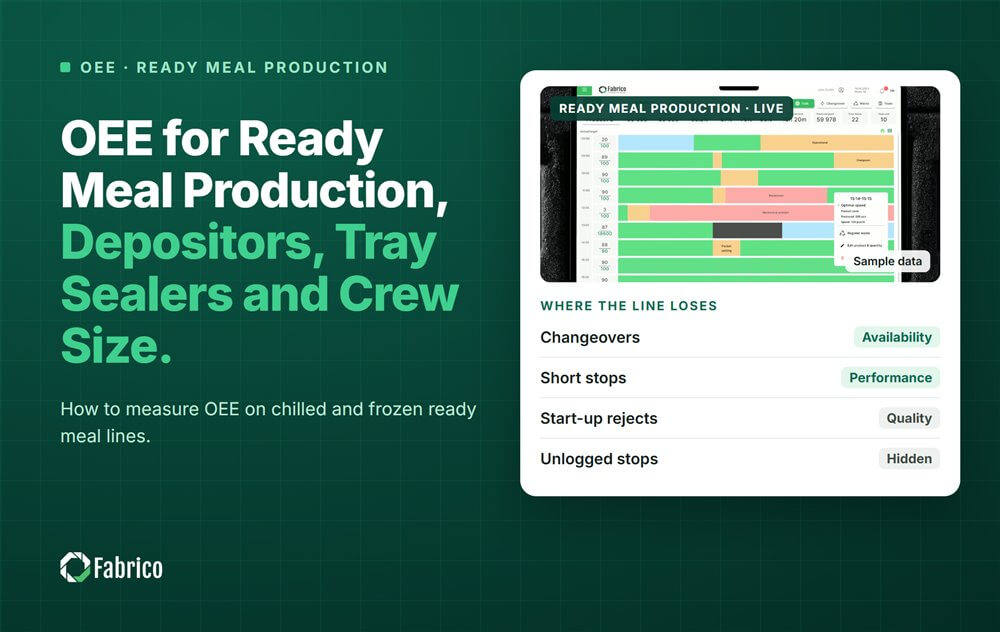

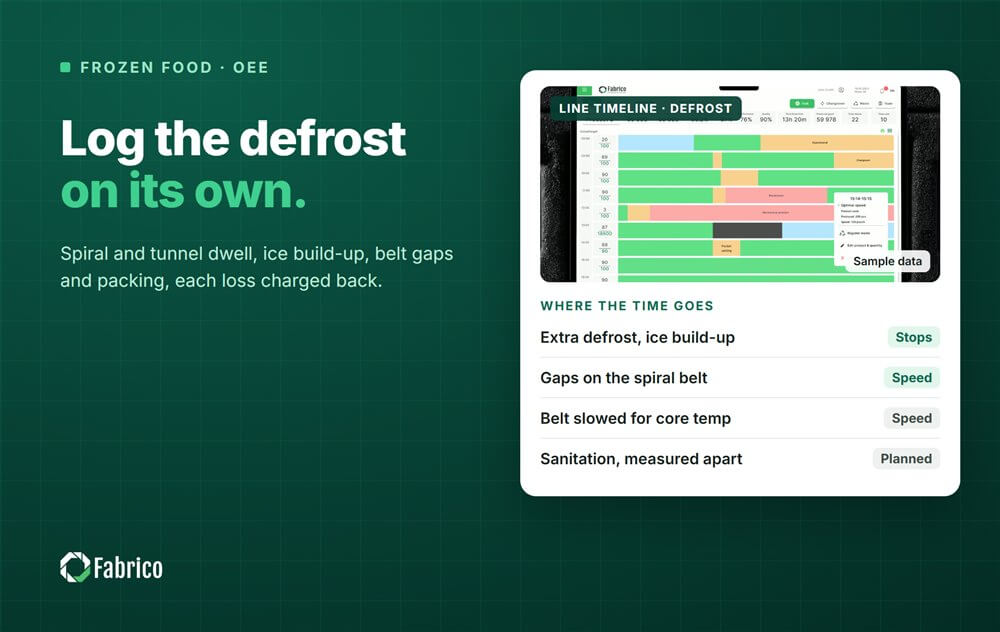






Real Fabrico tiles, sample data.