


 Login
 Blog
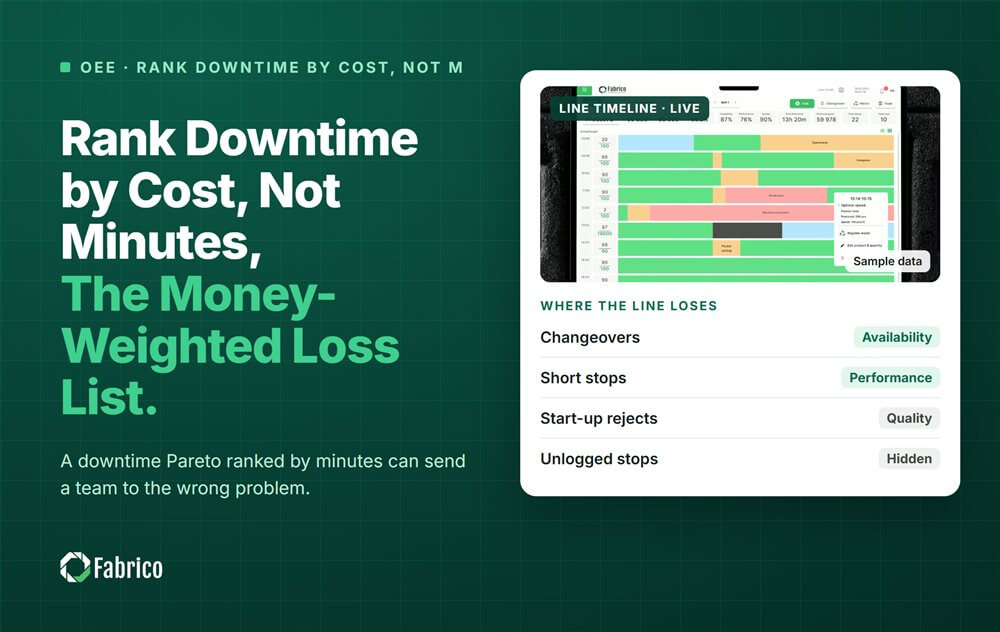
Rank Downtime by Cost, Not Minutes: The Money-Weighted Loss List

Key takeaways
- Minutes tell you how long a machine stood still; money tells you what the line lost.
- Price a stop by the bottleneck minutes it caused, at contribution margin, plus restart scrap.
- Short stops inside a buffer can be number one by minutes and last by cost.
- Keep three columns side by side: count, minutes and cost.
- Agree the cost inputs once with finance so nobody argues about the ranking.
Ranking downtime by cost means sorting stop reasons by what they cost the line, not by how many minutes they took. It often changes the order: frequent short stops on a fast machine fall down the list, and rare long stops that reach the bottleneck rise to the top.
Fabrico, an OEE and light MES platform, prices every loss in money and ranks losses by money, which is the same idea built into the daily report. This guide explains why a minutes Pareto can mislead, what goes into a cost Pareto, and how one canning line's priorities flip when you switch.
Why can a ranking by minutes point at the wrong problem?
A classic downtime Pareto adds up minutes per reason and sorts them. It is simple and it is a big step up from no Pareto at all. But a minute is not worth the same everywhere on a line.
- Buffers: a stop on a fast machine that ends before the buffer in front of the bottleneck runs dry costs no output.
- The bottleneck: a minute lost at the filler or seamer is a minute of output lost for the whole line.
- Restart scrap: some stops waste product every time the line starts again; others do not.
- Starved and blocked: minutes counted on the waiting machine belong to the machine that stopped first.
So the longest bar is not always the most expensive one. Our guide to Pareto charts in manufacturing covers the basic chart; this article adds the money.
What goes into a cost ranking of downtime?
| Column | What it means | Where it comes from |
|---|---|---|
| Stops | How often the reason happened | Stop log |
| Minutes | How long the machine was down | Stop log |
| Bottleneck minutes | How long the bottleneck stood still because of it | Machine states and buffer size |
| Cost per bottleneck minute | Bottleneck units per minute x contribution margin | Agreed with the controller |
| Restart scrap | Units wasted when the line starts again | Quality or line records |
| Cost | Bottleneck minutes x cost per minute + restart scrap | Calculated |
Use contribution margin, not the selling price, and check whether the line is sold out. If it is not, a lost minute costs the recovery (overtime, an extra shift) rather than the margin. Throughput accounting says the same thing: price a stop at contribution margin per bottleneck hour, never at an average cost per hour.
How do you build a cost ranking step by step?
- Find the bottleneck for the product that ran. On most beverage lines it is the filler. Our guide to finding the real constraint on linked packaging lines helps when it is not obvious.
- Measure the buffer in front of the bottleneck in minutes: units the conveyor holds divided by the bottleneck's speed.
- For each stop, work out how many bottleneck minutes it caused: zero if it ended inside the buffer, the rest if it did not.
- Multiply by the cost of one bottleneck minute and add restart scrap.
- Sort by cost, and keep minutes and count next to it.
- Repeat weekly, and split by SKU when a few formats cause most of the cost.
What does a worked cost ranking look like on a real line?
Sample line (illustrative numbers, not a customer): a canning line where the filler and seamer are the bottleneck at 600 cans a minute, with a contribution margin of $0.05 a can, or €0.05 in a euro plant. One bottleneck minute is worth 600 x $0.05 = $30. The conveyors protect the filler for 2 minutes on either side. The line is sold out. One week:
| Reason | Stops | Minutes | Bottleneck minutes | Cost | Rank by minutes | Rank by cost |
|---|---|---|---|---|---|---|
| Depalletiser short stops | 140 | 210 | 20 | $600 | 1 | 4 |
| Shrink wrapper film break | 18 | 126 | 90 | $2,700 | 2 | 1 |
| Seamer jam | 12 | 60 | 60 | $1,896 | 3 | 2 |
| Cans out at depalletiser | 3 | 45 | 39 | $1,170 | 4 | 3 |
| Total | 173 | 441 | 209 | $6,366 |
- Depalletiser short stops: 140 stops, 1.5 minutes on average. Most end inside the 2 minute buffer; a few longer ones, and some that came back to back before the conveyor refilled, cost 20 bottleneck minutes: 20 x $30 = $600.
- Film breaks: 18 stops of 7 minutes each. Each blocks the filler for 7 minus 2 = 5 minutes: 90 x $30 = $2,700.
- Seamer jams stop the bottleneck directly: 60 x $30 = $1,800, plus 12 restarts x 100 scrapped cans x $0.08 = $96. Total $1,896.
- Cans out: 3 stops of 15 minutes. Each starves the filler for 15 minus 2 = 13 minutes: 39 x $30 = $1,170.
By minutes, the team would start at the depalletiser. By cost, the shrink wrapper film comes first, worth more than four times as much as the depalletiser's short stops. The depalletiser still matters for the people who run it, but it is not this week's biggest money loss.
How do you keep minutes and money together?
Do not throw the minutes Pareto away. Each column answers a different question:
- Count: how often it happens. Frequent short stops point to handling, settings and centerlines.
- Minutes: how long the machine is down. Useful for the crew and for maintenance planning.
- Cost: what the line lost. This sets the priority for the plant manager and the weekly improvement list.
Short stops are also worth a second look in money terms when the buffer is small, or when they slow the whole line down. Our article on the cost of micro stops covers that case, and the OEE waterfall chart shows the same losses as a step down from planned time to good output.
Which mistakes break a cost ranking?
- Pricing every minute on every machine at the same rate.
- Using the selling price instead of contribution margin.
- Ignoring buffers, so short stops look expensive.
- Leaving starved and blocked minutes on the waiting machine.
- Forgetting restart scrap on reasons that stop the bottleneck.
- Changing the cost inputs every month, so nobody trusts the ranking.
Where Fabrico fits
Fabrico is a computer vision enabled Manufacturing Performance Platform. OEE and light MES come first, with computer vision on stops.
- Automatic downtime logging, so short stops are in the data.
- Every loss priced in money with the inputs you agree with your controller.
- Losses ranked by money, with minutes and count beside them.
- The operator confirms the reason in one tap, and a camera clip can serve as evidence for a stop.
- OEE live by line and shift, and one view across plants.
You start with a pilot on one line, with a baseline and a decision date agreed in advance. There is no free plan and there are no tiers: each plant gets a quote. See how stops are captured on our computer vision OEE page.
Frequently asked questions
What is a downtime Pareto chart?
It is a bar chart of stop reasons sorted from biggest to smallest, usually by minutes. It shows which few reasons cause most of the loss.
Why rank downtime by cost instead of minutes?
Because a minute on a machine with a buffer behind it can cost nothing, while a minute at the bottleneck costs line output. Ranking by cost puts the expensive stops first.
What cost per minute should I use?
The bottleneck's units per minute times the contribution margin per unit, if the line is sold out. If it is not, use the cost of recovering the output, such as overtime.
Should short stops be in a cost ranking?
Yes. Many will price low because the buffer absorbs them, but some will not, and you only know once they are logged and priced.
How often should the cost ranking be updated?
Weekly for the improvement list, and daily on the shift board. Review the cost inputs with finance every quarter.
See your stops ranked by money
Bring one line and last week's stop log. We will show the minutes Pareto and the cost Pareto side by side.
Latest from our blog



Real Fabrico tiles, sample data.