


 Login
 Blog
OEE Waterfall Chart: How to Build and Read the Loss Waterfall

Key takeaways
- An OEE waterfall starts at planned production time and subtracts each loss until only fully productive time is left.
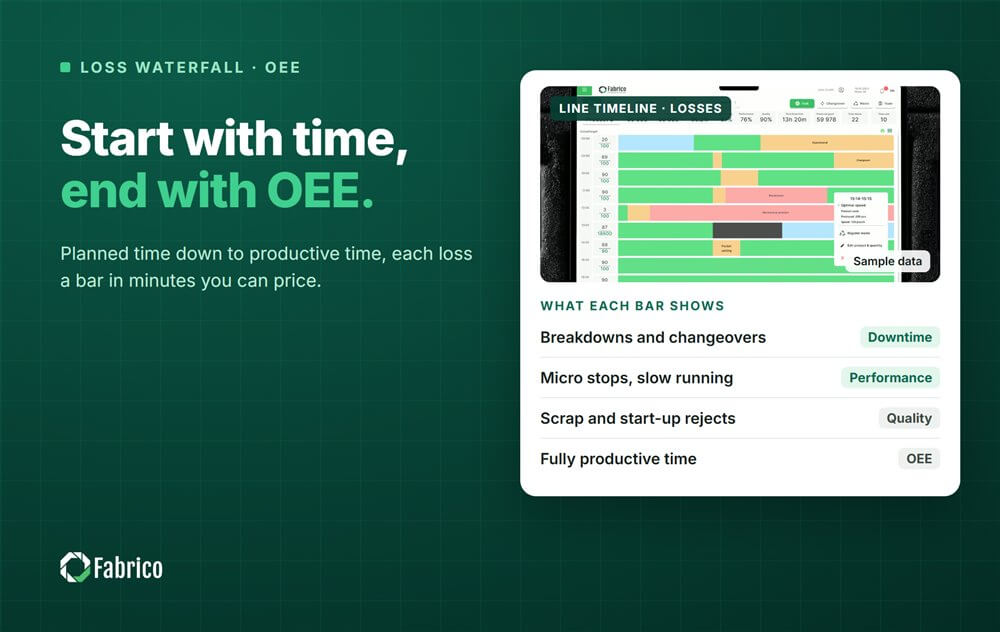
- Each bar is a loss in minutes: breakdowns and changeovers from Availability, micro stops and slow running from Performance, scrap and startup rejects from Quality.
- The last bar divided by the first is OEE, so the chart and the number always agree.
- Bars in minutes can be priced, which turns the waterfall into an ordered list of what to fix.
- Use the same definitions on every line, or two waterfalls cannot be compared.
The CI lead puts one OEE figure for line 2 on the screen at the monthly review. The plant manager asks the only question that matters: where did the rest go? The answer takes ten minutes of scrolling through stop lists, and by the end nobody remembers the first number.
An OEE waterfall chart answers that question in one picture. It starts with the time the line was planned to produce, takes away each loss as a bar, and ends with the time spent making good product at ideal speed. Every lost minute has a place, and the largest bar is the first thing anyone sees.
This guide shows how to build the waterfall step by step, a worked sample with every number checked, how to read it, how to price each bar and the mistakes that make the chart lie.
What an OEE waterfall chart shows
A waterfall is a bar chart where each bar starts where the previous one ended. For OEE, the first bar is planned production time. Each following bar is a loss that brings the remaining time down, and the last bar is fully productive time: good count times ideal cycle time.
The losses follow the six big losses. Equipment failure and setup and adjustment reduce Availability. Idling and minor stops and reduced speed reduce Performance. Process defects and reduced yield, the startup rejects, reduce Quality. Our guide to the six big losses explains each one.
Because the chart works in time, it shows what a single OEE percentage hides: which loss is biggest, and how big it is in minutes that a crew can relate to.

The time model behind the waterfall
| Level | Definition | What is taken away to reach the next level |
|---|---|---|
| Planned production time | Shift time minus planned stops such as breaks | Availability losses: breakdowns, changeovers, waiting for material, waiting for approval |
| Run time | Time the line actually ran | Performance losses: micro stops and slow running |
| Net run time | Total count times ideal cycle time | Quality losses: scrap and startup rejects |
| Fully productive time | Good count times ideal cycle time | Nothing: this is the OEE time |
OEE is fully productive time divided by planned production time. Availability, Performance and Quality are the ratios between neighbouring levels, and multiplied together they give the same OEE. The arithmetic is covered in our guide to OEE calculation.
How to build the waterfall, step by step
- Fix planned production time. Shift time minus the planned stops your plant has agreed. Write the rule down.
- List the Availability losses in minutes. Breakdowns, changeovers, waiting for material, waiting for first off approval, each from the logged stops and their reasons.
- Compute run time. Planned production time minus the Availability losses.
- Compute the Performance loss. Run time minus total count times ideal cycle time. Split it into logged micro stops and the rest, which is slow running.
- Compute the Quality loss. Rejects times ideal cycle time. Split startup rejects after changeovers from scrap in steady running.
- Check the end. Good count times ideal cycle time must equal what is left. If it does not, a loss is missing or counted twice.
Step 4 is where most charts go vague. The Performance loss is calculated, not logged, so it appears whether or not anyone recorded a micro stop. If none were recorded, the whole bar is slow running by default, and that is usually wrong. Our article on OEE performance shows how to split it.
A worked OEE waterfall
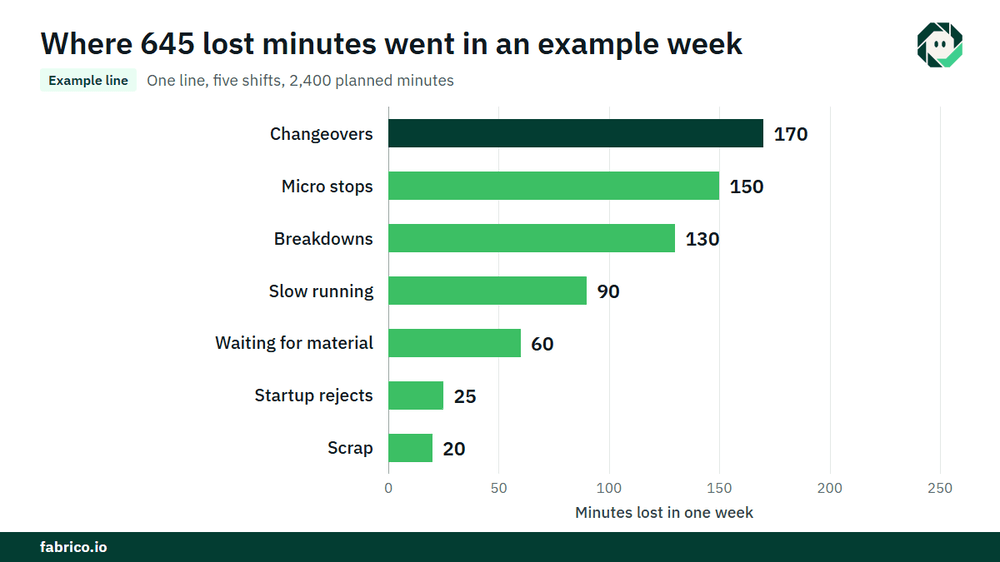
Sample line (illustrative numbers, not a customer): one line, one week, five shifts of 480 minutes with breaks already removed, so planned production time is 2,400 minutes. The ideal rate is 80 units a minute. The line made 144,000 units, of which 3,600 were rejected: 2,000 startup rejects after changeovers and 1,600 scrap in steady running. Logged stops: breakdowns 130 minutes, changeovers 170, waiting for material 60, micro stops 150.
| Bar | Lost minutes | Time left |
|---|---|---|
| Planned production time | 2,400 | |
| Breakdowns | 130 | 2,270 |
| Changeovers | 170 | 2,100 |
| Waiting for material | 60 | 2,040 (run time) |
| Micro stops | 150 | 1,890 |
| Slow running | 90 | 1,800 (net run time) |
| Startup rejects, 2,000 units / 80 | 25 | 1,775 |
| Scrap, 1,600 units / 80 | 20 | 1,755 (fully productive time) |
Net run time is 144,000 units / 80 = 1,800 minutes, so the Performance loss is 2,040 minus 1,800 = 240 minutes: 150 of logged micro stops and 90 of slow running. Good count is 140,400 units, and 140,400 / 80 = 1,755 minutes, which matches the last bar.
- Availability = 2,040 / 2,400 = 85.0%
- Performance = 1,800 / 2,040 = 88.2%
- Quality = 140,400 / 144,000 = 97.5%
- OEE = 0.850 x 0.882 x 0.975 = 73.1%, and 1,755 / 2,400 = 73.1%
Now price the bars. The line is the constraint and sold out, and each unit carries $0.15 of contribution, €0.15 in a euro plant, so a lost minute is worth 80 x $0.15 = $12 (€12). Changeovers cost 170 x $12 = $2,040 (€2,040), micro stops $1,800, breakdowns $1,560, slow running $1,080, waiting for material $720, startup rejects $300 and scrap $240, the last two before material. The 645 lost minutes are worth $7,740 (€7,740) for the week.
How to read an OEE waterfall
Start with the largest bar, not with the factor that looks lowest. In the sample, Quality is the factor with the smallest loss, Availability carries three bars and the single largest bar is changeovers. That is where the week's first action goes.
Then read the bars by owner. Availability bars mostly go to changeover teams, planning and the technicians. Performance bars go to the line crew and the CI lead: settings, jams, material quality. Quality bars go to process and quality engineering. One chart, three conversations, each with its own number in minutes.
Finally, compare with last week's waterfall, built the same way. A bar that grows is a new problem. A bar that shrinks after an action is the proof the action worked. The money behind the gap between planned time and the last bar is what our guide to the hidden factory calls capacity you already own.
Ideal cycle time and planned time decide the shape
Two definitions change the chart more than any loss does. The ideal cycle time sets the size of the Performance bars. Set it from a good day's average and slow running shrinks on paper. Set it from the rated speed of the machine, or the best rate the line has shown it can hold, and the bar tells the truth. If the slow running bar ever comes out negative, the ideal rate is set too slow. See our guide to ideal cycle time.
Planned production time sets the top of the chart. Move changeovers into planned time and the changeover bar disappears, while the line still stands still for the same minutes. Many plants solve this with a standard changeover time: the standard is planned, every minute over it is a bar.
Where each bar's data comes from
| Bar | Data source | Typical gap |
|---|---|---|
| Breakdowns | Machine stop signal plus the reason confirmed by the operator | Reasons missing or vague |
| Changeovers | Count stops at the last good part, restarts, reaches rate | Clock stopped at mechanical finish |
| Waiting | Logged stop with a waiting reason | Booked as other |
| Micro stops | Machine signal at short resolution, a camera where the signal only says stopped | Too short for a paper log |
| Slow running | Total count against the ideal rate | Wrong ideal rate |
| Rejects | Reject counter, QC records | Startup rejects thrown away uncounted |
Mistakes that make the waterfall lie
- Bars in percentages. Use minutes. Percentages of different bases do not add up.
- One Performance bar with nothing inside. Split it, or the biggest loss stays anonymous.
- Several lines in one waterfall. Lines with different ideal rates need their own charts, or a sum built from each line's minutes.
- Definitions that change. A new rule for planned time makes this week's chart incomparable with last week's.
- No money. A minute on the constraint and a minute on a line with spare capacity look the same until they are priced.
Where Fabrico fits
Fabrico is a computer vision enabled Manufacturing Performance Platform. OEE and light MES come first: automatic downtime logging and OEE live by line and shift give the minutes for every bar of the waterfall from machine data, using one set of definitions agreed with the plant.
The operator confirms the reason in one tap, so the Availability bars carry real reasons. Where a camera watches the station, a camera clip is kept as evidence for a stop, which helps turn part of the Performance loss into named short stops. Losses are priced in money and ranked by money, so the waterfall comes with its price. When a bar is a breakdown, a work order goes to the right technician with its cost. Groups get one view across plants, and you can start on one line.
Each plant gets a quote after a review of its lines.
Frequently asked questions
What is an OEE waterfall chart?
A bar chart that starts at planned production time and subtracts each loss, from breakdowns and changeovers to micro stops, slow running and rejects, until only fully productive time is left. The last bar divided by the first is OEE.
How do you calculate the performance loss for the waterfall?
Subtract total count times ideal cycle time from run time. Then split the result into logged micro stops and slow running, which is what remains.
Should the waterfall be in minutes or percentages?
Minutes. They add up, they can be priced, and a crew can picture them. Show the percentages for the three factors next to the chart if people want them.
What is the difference between an OEE waterfall and a downtime Pareto?
A Pareto ranks the reasons for stops. A waterfall shows every loss in the time model, including slow running and rejects that a stop Pareto leaves out.
Can I build an OEE waterfall in Excel?
Yes, with the minutes for each loss and a stacked bar chart. The hard part is not the chart but getting reliable minutes for micro stops, slow running and rejects.
See your line's loss waterfall
Bring one line's numbers to a demo. We will build its waterfall from planned time to good output and put a price on each bar.








Real Fabrico tiles, sample data.