Key takeaways
See our roundup of monitoring systems that surface this data.
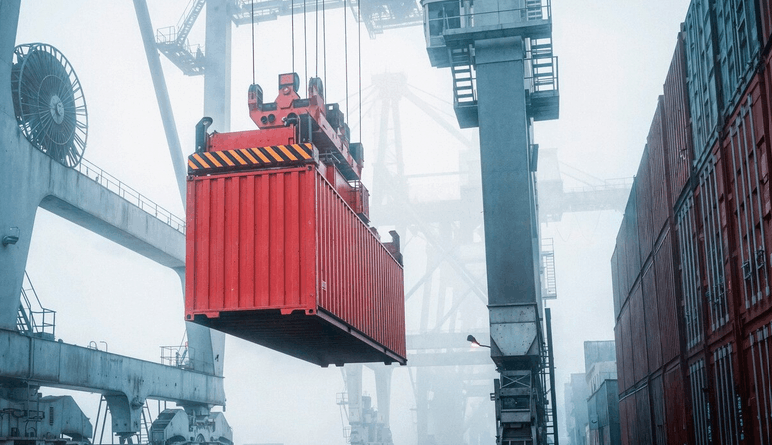
Every line has a theoretical maximum: if it ran at full speed, with no stops and no defects, for all the time it was scheduled, how much would it make? Production loss analysis is the structured accounting of the gap between that maximum and what actually came out, broken down by cause so you know what to fix first.
Without it, improvement effort chases whatever failed most recently or most visibly. With it, effort goes to the losses that actually cost the most output, which are often quiet.
The standard framework sorts losses into six categories, grouped by which part of OEE they hit:
The six losses are the detail behind the OEE headline. Breakdowns and changeovers pull down availability; minor stops and reduced speed pull down performance; startup and production defects pull down quality. OEE tells you the score; loss analysis tells you which of the six is costing you the points. The pillar on OEE for manufacturing covers the calculation, and manufacturing KPIs covers how it sits among other metrics.
Teams expect the big number to be breakdowns, because breakdowns are dramatic and get attention. In practice, minor stops and small speed losses are often the larger total, precisely because no single event is big enough to log. A line that loses ninety seconds twenty times a shift bleeds more than one that breaks down once. Surfacing that requires automatic capture; manual logs miss it. See downtime versus uptime and automatic downtime tracking.
A loss analysis that ends in a chart is wasted. Each major loss should lead to a specific intervention: a changeover that becomes a standard work routine, a recurring minor stop that becomes a root cause investigation, a breakdown pattern that becomes a preventive task. The point is always the next action, not the report.
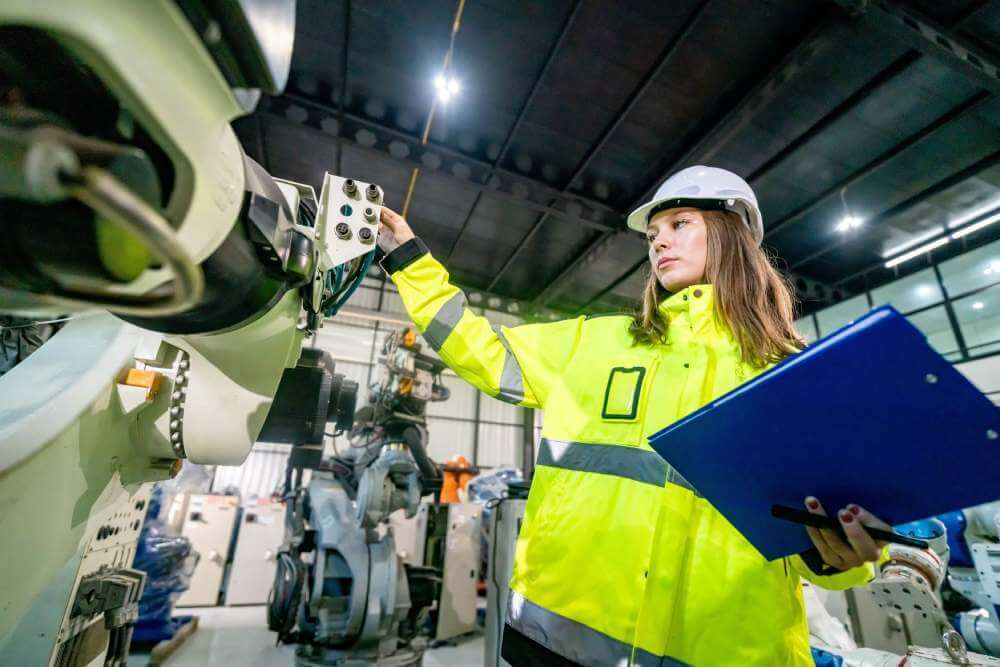
Fabrico captures every stop automatically, including the short minor stops manual logging misses, and attaches the true cause using computer vision, so the loss breakdown reflects what actually happened rather than what someone remembered. Because OEE and CMMS share one platform, a loss pattern becomes a work order or a preventive task without leaving the system. Fabrico is built and hosted in the EU with data residency in mind and is ISO 27001 certified. To see your six big losses on real data, book a demo.
Breakdowns, setup and changeover, minor stops and idling, reduced speed, startup defects, and production defects. The first two reduce availability, the next two reduce performance, and the last two reduce quality, which are the three components of OEE.
OEE is the summary score. Production loss analysis is the breakdown of why the score is what it is, sorted by cause, so you know which loss to attack first. You need OEE to know where you stand and loss analysis to know what to do.
Often minor stops and reduced speed, not breakdowns, because each small event is too minor to log but they accumulate. That is why automatic capture matters; manual logging systematically undercounts the losses that hurt most.
Capture stops and their reasons accurately, group them into the six categories, and rank by total time lost. Attack the largest category first, confirm it dropped, then move to the next. Honest data first, then the framework.