


 Login
 Blog
Why OEE Drops When You Start Tracking It Automatically

Key takeaways
- When a plant moves to automatic OEE, the number often falls. The line did not get worse; the inputs got stricter.
- Logging short stops does not change OEE on its own. Availability falls and Performance rises in proportion.
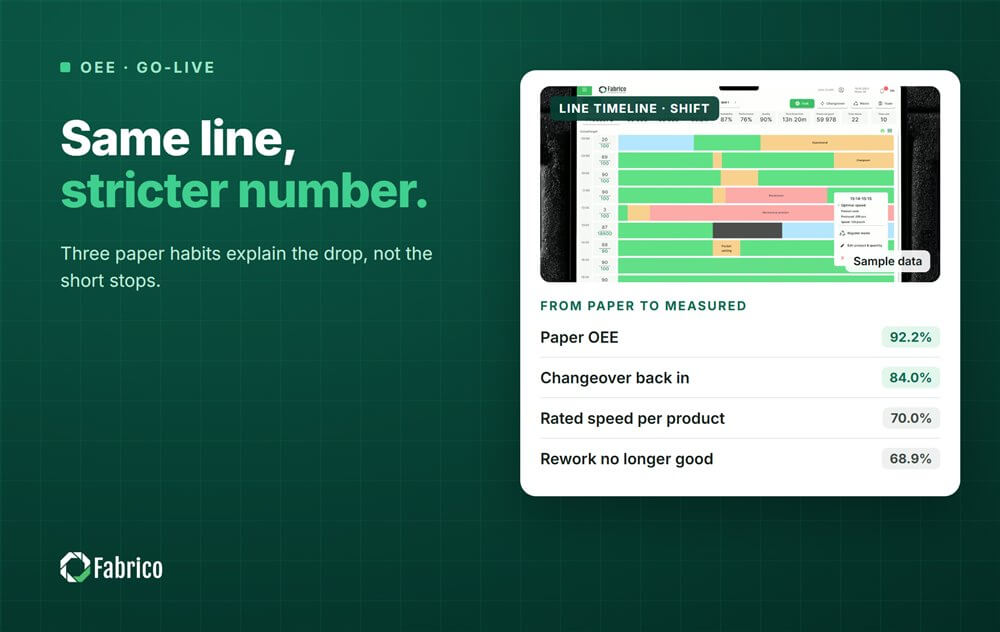
- The worked example drops 23.3 points, from 92.2% to 68.9%, with nothing changing on the line.
- Agree the definitions before go-live, run both numbers side by side, and tell the team why.
Fabrico, OEE and light MES (manufacturing execution system) software with AI cameras, logs stops automatically and prices each loss. The plant's own definitions still decide the number.
Below: what really changes at go-live, a worked shift that drops 23.3 points, and how to handle the first weeks.
Do the short stops explain the drop?
Not on their own, which surprises many people. The reference site oee.com describes a minor stop as "typically a minute or two", cleared by the operator. Paper logs miss many of them.
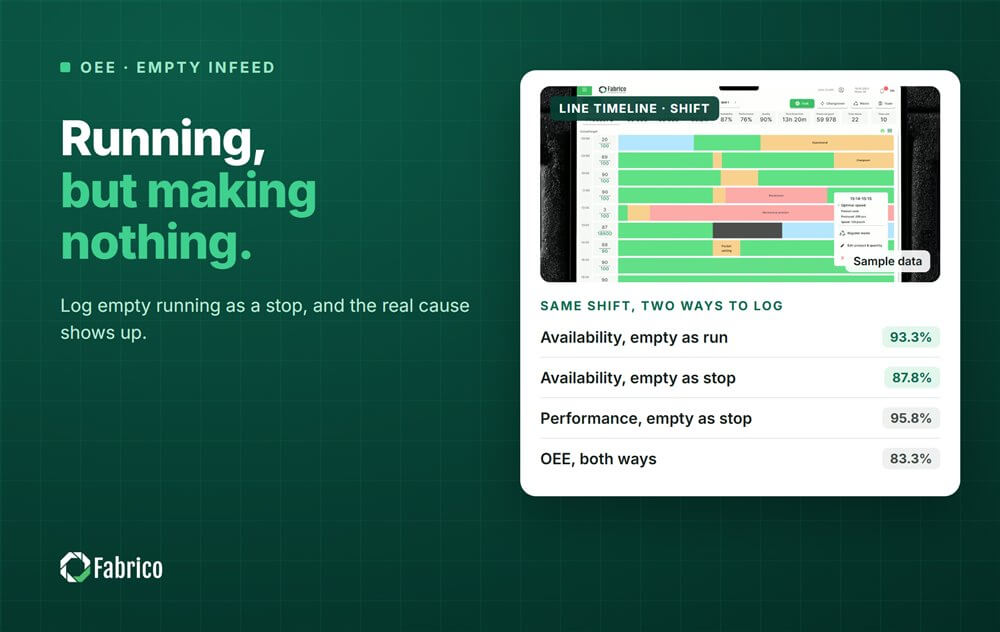
When automatic logging catches them, run time gets shorter. Availability falls, and Performance rises in proportion, because the same output was made in less run time. A x P stays the same.
OEE = good count x ideal cycle time / planned production time. Short stops are not in that formula. They change how the loss is split, which matters for finding the cause. Our micro stops guide explains why they still deserve attention.
This holds when the old number used the machine counter. If Performance was estimated, or the count was written by hand, the missed stops did inflate it. And the plant's cutoff decides whether a short stop counts as downtime at all.
So what really makes OEE fall?
Christoph Roser names three ways OEE gets inflated, often without anyone meaning to. The switch to automatic tracking is usually when a plant resets all three inputs.
| The old habit | What changes at go-live | Effect on OEE |
|---|---|---|
| Long changeovers booked as planned stops | Full planned time | Down |
| A good day's speed as the ideal | Rated speed per product | Down |
| Rework counted as good | Good units at the line end | Down |
| Short stops missing from the log | Every logged stop | No change |
Roser puts the true OEE of most Western processes at 40 to 60%. oee.com notes that most plants score closer to 60%. The 85% "world class" figure comes from Nakajima's 1984 Introduction to TPM (total productive maintenance), rooted in 1970s Japanese car plants.
A paper OEE above 85% on a busy line is a reason to check the inputs. Our article on why OEE benchmarks are often wrong covers this.
What does a worked example of the drop look like?
Sample line (illustrative numbers, not a customer): one shift with 450 minutes of planned time. On paper, a 40 minute changeover was booked as planned.
The paper system uses an ideal cycle time of 1.2 seconds; the product is rated at 1.0 second. The counter shows 18,900 units. 300 were reworked and counted as good on paper.
| Step | Planned | OEE |
|---|---|---|
| Paper | 410 min | 92.2% |
| Changeover back in | 450 min | 84.0% |
| Rated speed, 1.0 s | 450 min | 70.0% |
| Rework out | 450 min | 68.9% |
- Paper: 18,900 x 1.2 seconds = 378 minutes, and 378 / 410 = 92.2%.
- Changeover back in planned time: 378 / 450 = 84.0%.
- Rated speed: 18,900 x 1.0 second = 315 minutes, and 315 / 450 = 70.0%.
- Rework no longer good: 18,600 x 1.0 second = 310 minutes, and 310 / 450 = 68.9%.
OEE fell by 23.3 points. The machine, the crew and the output stayed the same. 8.2 points came from the planned time, 14.0 from the ideal speed and 1.1 from the rework. Our ideal cycle time guide covers the biggest step.
How do you handle the first weeks?
- Agree the definitions before go-live: planned time, the rated speed per product, what counts as good.
- Run the old and the new number side by side for a few weeks, with the bridge between them.
- Tell the team before the screen goes up. A lower number nobody explained feels like blame.
- Reset targets on the new baseline. A target set on the paper number is out of reach on day one.
- Use the new split. Logged short stops have moved from Performance to Availability, where you can see them.
Our guide to manual vs automatic downtime tracking covers the switch in more depth.
What mistakes do plants make when OEE drops?
- Blaming the software and going back to paper.
- Keeping targets set on the old, inflated number.
- Moving the changeover back into "planned" to recover the points.
- Not telling operators why the number changed.
Where Fabrico fits
Fabrico is a computer vision enabled Manufacturing Performance Platform. OEE and light MES come first. Automatic downtime logging from the machine signal and OEE live by line and shift run on definitions agreed at the pilot.
- Automatic downtime logging, so short stops are on record too.
- The operator confirms the reason in one tap, so new stops get a cause, not just a time.
- Losses ranked by money, so the first improvements go where they pay most.
Where a stop needs proof, a camera clip is evidence for what happened. You start on one line, with a baseline and a decision date agreed in advance. There is no free plan and there are no tiers: each plant gets a quote.
Frequently asked questions
Why did our OEE drop after installing OEE software?
Usually because the plant reset its inputs at go-live. The old number often used a shorter planned time, a slow ideal speed and rework counted as good. The line did not get worse. The number became stricter, and the new gap shows real capacity you can win back.
Do missed short stops lower OEE?
Not on their own. Logging them lowers Availability and raises Performance in proportion, because the same output was made in less run time. OEE stays the same and the diagnosis changes. This assumes the old number used the machine counter, not an estimated Performance figure.
How much does OEE usually drop?
It depends on how generous the old inputs were. In the worked example it falls 23.3 points, most of it from the ideal speed. A plant whose paper data already used full planned time and real rated speeds may see only a small change after the switch.
Should we change our OEE targets after the switch?
Yes. Set new targets on the new baseline. Targets set on the old number are out of reach from day one, and that makes the team distrust the system. Show the bridge between the two numbers, then set a target that is a fair step up from the measured start.
How do we explain the drop to operators?
Before go-live, show them the bridge from the old number to the new one, step by step. Make clear that the number measures the line, not the people. Then show them the new split, because the short stops they deal with every day are finally visible to everyone.
See your honest OEE baseline in a demo
Bring one line and its paper OEE for last month. We will show the bridge to the measured number, step by step.
Latest from our blog



Real Fabrico tiles, sample data.