Menu
CMMS KPI Dashboard: The 8 Maintenance Metrics That Drive Decisions

CMMS KPI Dashboard: The 8 Maintenance Metrics That Drive Decisions

The 8 CMMS KPIs that maintenance leaders track daily: PM compliance, reactive ratio, MTBF, cost per unit, first-time fix rate, backlog, stockouts, and budget variance.
CMMS KPI Dashboard: The 8 Maintenance Metrics That Drive Decisions

Why Your Maintenance Dashboard Is Showing the Wrong Metrics

Key Takeaways: Most CMMS dashboards show activity metrics, work orders created, tasks completed, hours logged. These measure effort, not outcomes. Fabrico's management dashboard is built around 8 metrics that connect maintenance execution to production performance and financial results. If your current platform can't generate these without custom reporting, it's a reporting tool masquerading as a management system.

CMMS KPI dashboard design determines whether maintenance management is data-driven or gut-driven.

The vanity metric problem: most CMMS dashboards show work orders completed, total PM tasks executed, and total maintenance hours. These measure activity without connecting to outcomes.

A maintenance team can complete 200 work orders per week and still fail at their job if those aren't the right 200 work orders. Volume metrics reward action. Outcome metrics reward results.

The 8 Maintenance KPIs That Actually Drive Decisions

Eight metrics that connect maintenance execution to production and financial outcomes:

  1. PM Compliance Rate: Scheduled PMs completed on time ÷ total PMs scheduled. Target: 85%+. Leading indicator, declining PM compliance predicts breakdowns 4-8 weeks in advance.
  2. Reactive vs Planned Ratio: Target: under 30% reactive. Each reactive work order costs 3-5x more than a planned repair for the same task.
  3. MTBF by Critical Asset: Trending upward = improving reliability. Declining MTBF on a critical asset = impending failure.
  4. Maintenance Cost Per Unit: Total maintenance spend ÷ units produced. The only metric that enables valid cross-site comparison regardless of facility size.
  5. First-Time Fix Rate: Target: 85%+. Low FTFR signals parts gaps, skills gaps, or inadequate diagnostic procedures.
  6. Overdue Work Order Backlog: Target: near zero for P1 critical assets. Growing backlog is early warning of resource constraints.
  7. Parts Stockout Frequency: Target: under 2% of work orders affected. Stockouts create 30-60 minute delays on average.
  8. Maintenance Spend vs Budget: Monthly variance tracking, the financial control metric CFOs reference most.

The 5-Second Rule for Maintenance Dashboard Design

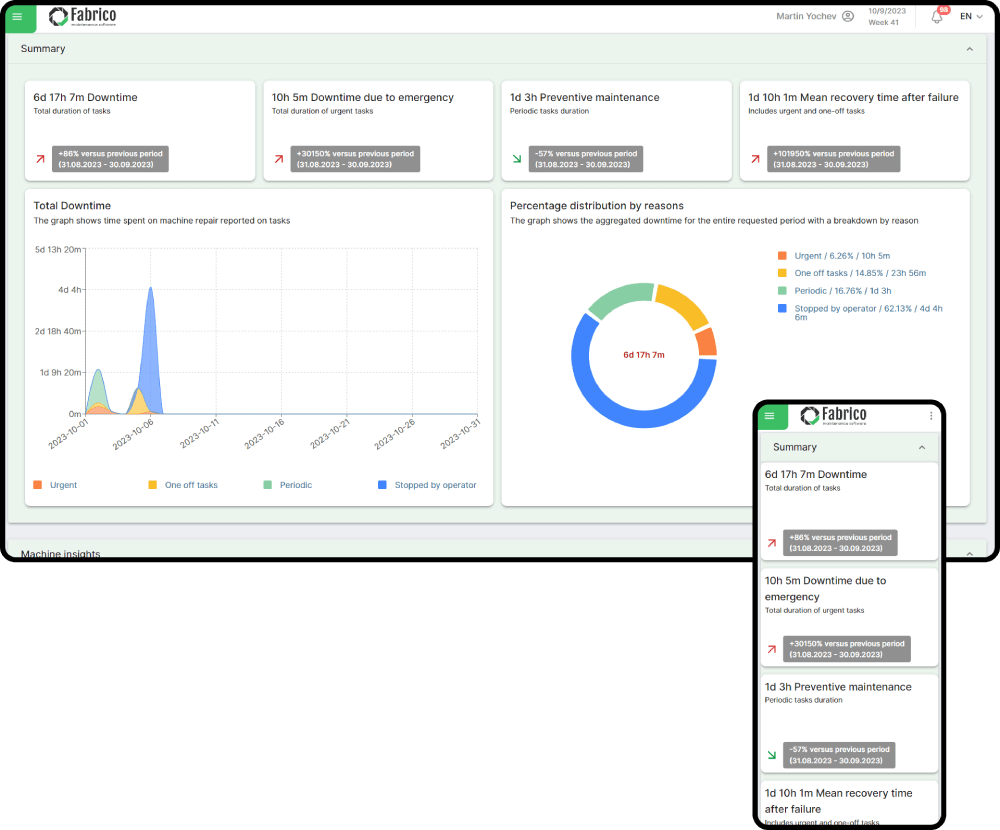
A Plant Manager should determine whether maintenance is on track within 5 seconds of opening the dashboard.

If it takes longer, the dashboard is failing its primary job.

Fabrico's management dashboard applies three design principles:

  • Traffic light status: Green/amber/red for each KPI vs target, humans process color faster than numbers
  • Trend, not just status: Is PM compliance at 82% improving or declining from last month? A trend changes the conversation entirely.
  • Mobile-accessible: Plant managers review dashboards between meetings on phones. Desktop-only dashboards don't get used.

The daily 10-minute routine that creates accountability: maintenance manager presents all 8 KPIs in the morning production meeting, flags anything below target, confirms corrective actions. This routine, more than any technology, is what drives sustained maintenance performance improvement.

Fabrico generates all 8 KPIs automatically. No SQL queries. No weekly report preparation. No analyst required.

Related articles

Latest from our blog

Define Your Reliability Roadmap
Validate Your Potential ROI: Book a Live Demo
Define Your Reliability Roadmap
By clicking the Accept button, you are giving your consent to the use of cookies when accessing this website and utilizing our services. To learn more about how cookies are used and managed, please refer to our Privacy Policy and Cookies Declaration