Key takeaways

The "Vanity Metric" Trap: Most dashboards are full of numbers that look impressive but don't help you make decisions. You need metrics that drive action.
Leading vs. Lagging: A good dashboard balances "What happened?" (Lagging) with "What is coming?" (Leading).
The Automated Analyst: How to use Fabrico to populate your dashboard in real-time, eliminating the "End of Month" Excel crunch.
Want OEE captured straight from your machines, no manual logs?
See it liveIf you put a dashboard up on the wall and nobody looks at it, is it really a dashboard? Or is it just expensive wallpaper?
Many Maintenance Managers ("Mike") spend hours every month compiling reports for the Plant Manager ("Paula").
They paste graphs into PowerPoint. They calculate averages in Excel.
And when they present it, Paula asks one question: "So, are we getting better or worse?"
And Mike stammers, "Well, work order volume is up, but costs are flat..."
This is a failure of Data Storytelling.
A modern Maintenance KPI Dashboard shouldn't just show you data.
It should show you the health of your operation at a glance. It should answer Paula's question in 5 seconds.
Here are the 7 Essential KPIs you need on your 2026 dashboard, and how to track them without spreadsheets.
Before we list the metrics, you must understand the balance.
Lagging Indicators (The Scoreboard): These tell you what happened (e.g., Downtime). You cannot change them; they are history.
Leading Indicators (The Playbook): These predict the future (e.g., PM Compliance). If you improve these, the Lagging indicators will get better next month.
Your dashboard needs both.
Type: The "Holy Grail" Metric.
Most maintenance dashboards ignore this. They focus on "Repair Time." But the CEO cares about "Production Time."
OEE combines Availability (Uptime), Performance (Speed), and Quality (Yield).
Why it matters: If Maintenance fixes a machine quickly (Low MTTR) but the machine runs at half speed afterwards, you have failed. OEE exposes that failure.
How Fabrico tracks it: We connect to the PLC. We calculate OEE automatically. If it drops below 85%, the dashboard turns red.
Type: Leading Indicator (Control).
This is the single best measure of a maintenance team's maturity.
The Target: 80% Planned / 20% Unplanned.
The Reality: Most factories are 40% Planned / 60% Unplanned (Firefighting).
How Fabrico tracks it: Every Work Order has a type. Fabrico visualizes the ratio in a simple pie chart. If the "Unplanned" slice grows, you know your Preventive Maintenance plan is failing.
Type: Leading Indicator (Discipline).
This measures if you are doing what you said you would do.
Formula: (PMs Completed On Time / Total PMs Scheduled) x 100.
Why it matters: If PMC drops below 90% this month, your Breakdowns will go up next month. It is a warning light.
How Fabrico tracks it: The dashboard shows a live percentage. You can drill down to see who is missing their PMs (e.g., "Shift B is only at 70%").
Type: Lagging Indicator (Reliability).
This measures the average time a machine runs before it breaks.
Goal: Keep this number going UP.
Why it matters: It tells you if your repairs are effective. If you fix a motor but it breaks again in 3 days, your MTBF tanks. This points to poor workmanship or bad spare parts.
How Fabrico tracks it: Since we log every "Down" event, we calculate the run-time between them automatically.
Type: Lagging Indicator (Maintainability).
This measures speed. When it breaks, how fast do we fix it?
Goal: Keep this number going DOWN.
Why it matters: High MTTR usually means "Waiting." Waiting for parts, waiting for a decision, or waiting for a technician.
How Fabrico tracks it: The timer starts when the operator reports the issue and stops when the technician closes the ticket. We capture the actual wrench time vs. the response time.
Type: Leading Indicator (Resource Health).
How much work is in the queue?
Formula: (Total Estimated Hours in Backlog / Total Technician Hours Available per Week).
The Sweet Spot: 2 to 4 weeks.
Less than 2 weeks: You are overstaffed.
More than 6 weeks: You are drowning. Things are breaking faster than you can fix them.
How Fabrico tracks it: As new work orders enter the system, the "Backlog Meter" rises. This is Mike's best tool for asking Paula for more budget or headcount.
Type: The "CFO" Metric.
This combines everything: Spare Parts Cost + Labor Cost + Downtime Cost.
Why it matters: A cheap machine might cost you €50,000 a year to maintain. An expensive machine might cost €5,000. TCO proves which one is actually cheaper.
How Fabrico tracks it: We pull labor rates, parts prices, and production loss values into a single dashboard widget.
If you are manually typing these numbers into a spreadsheet every Friday, your data is already dead.
Modern Dashboards must be Live.
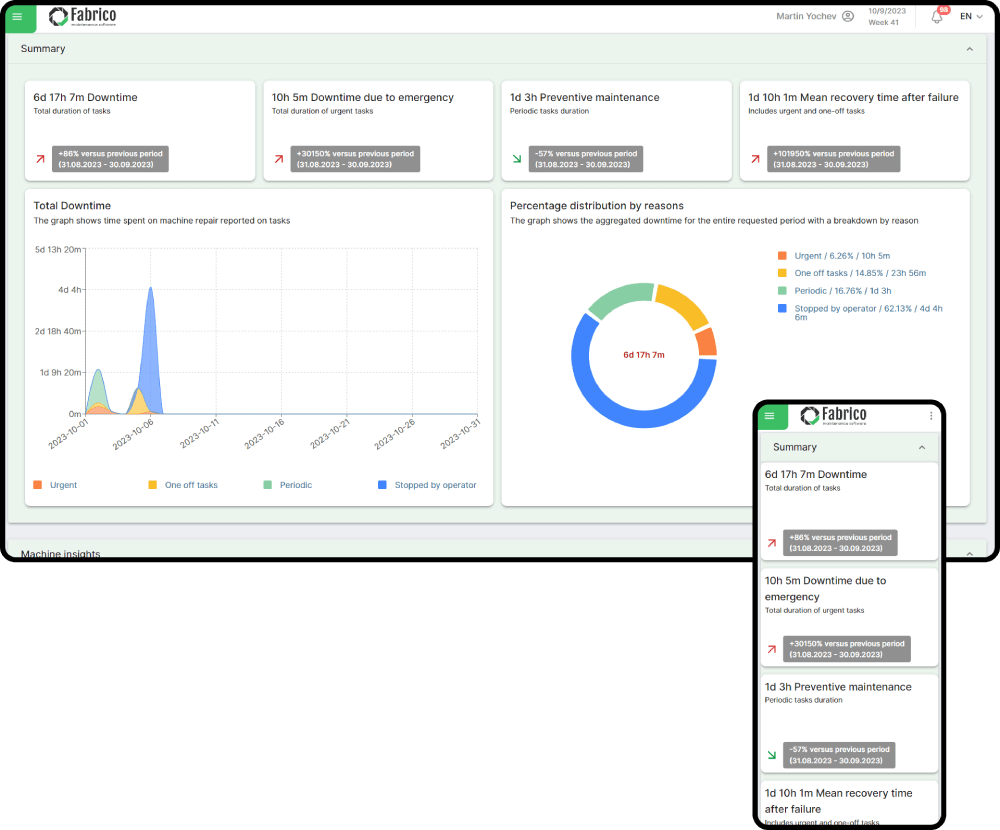
In Fabrico, these 7 KPIs are pre-built widgets.
Technicians feed the data by working in the app.
Machines feed the data via sensors.
The Dashboard updates instantly.
When Paula walks into your office and asks, "How are we doing?", you don't open a PowerPoint. You point to the screen on the wall.
Stop reporting. Start analyzing.
[Book a Demo with Fabrico] to see your factory's health in real-time.
See OEE & CMMS live in 15 minutes.
Book a demoTurn downtime into a number your team can actually act on.
Get a demoA maintenance KPI dashboard is a visual display of the key metrics that show how maintenance is performing, such as OEE, downtime, MTBF, MTTR, PM compliance, and backlog. It brings data together in one place so teams and managers can see performance at a glance and act on it.
Useful KPIs include OEE and downtime for equipment effectiveness, MTBF and MTTR for reliability, preventive maintenance compliance and backlog for workflow health, and maintenance cost. The best dashboards show a focused set of metrics tied directly to your goals, not every possible number.
By making performance visible in real time, a dashboard helps teams spot problems early, focus on the biggest issues, and track whether improvements are working. Shared dashboards also align technicians and managers around the same priorities and data.











 Login
Login
 Blog
Blog