


 Login
 Blog
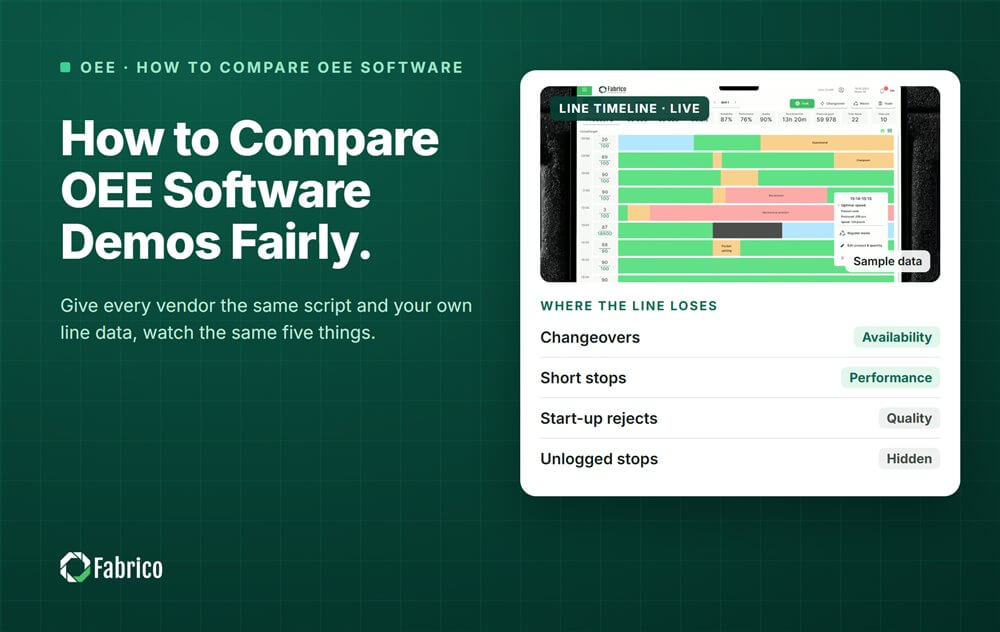
How to Compare OEE Software Demos Fairly

Key takeaways
- To compare OEE demos fairly, give every vendor the same script and score each one the same way.
- Bring your own data: a stop log export, one shift's counts, or a short video of a stop.
- Watch the same five things: time to see a stop, stop reason entry, OEE by line and shift, losses in money, proof.
- Score straight after each demo, alone first, then compare.
- Treat "on the roadmap" as not there.
To compare OEE software demos fairly, give every vendor the same script and ask them to run it on your own data. Score each demo straight after the call, against the same anchors. Judge what you saw working on screen, not what you were told.
Three demos in one week. By Friday, the team remembers the presenter with the best story, not which tool showed a stop from the filler.
This guide is for plant managers, CI (continuous improvement) leads and IT teams with a shortlist of OEE vendors. It comes from Fabrico, a vendor of OEE and light MES software with computer vision on stops. It is the method we want buyers to use on us too.
Why do all OEE software demos look good?
Because every vendor shows its best path, on clean sample data, with a practiced presenter. Without a plan, the team compares presenters, not software.
A fair comparison fixes three things: the script, the data and the scoring.
What script should every vendor follow?
A script built around your losses, sent to every vendor at the same time, run in the same order.
- A stop happens on the line. How fast does it appear on the screen, and where?
- The operator gives the reason. Show the screen at the line, the taps and the reason list.
- OEE by line and shift. Show today's OEE and its three factors, then last shift's.
- Losses in money. Show the top losses ranked by cost, and who sets the rate for a lost minute.
- The definitions. Show where ideal cycle time and planned stops are set, and who can change them.
- An old machine. Show how a machine with no usable PLC (programmable logic controller) gets connected.
- A change. Add a new stop reason live, while you watch.
Give each step a time box. If a vendor skips a step, score it as not shown. Our MES demo checklist has more questions for the wider scope.
Should you bring your own data to the demo?
Yes, where you can: your own data turns a show into a test. Ask IT first what may leave the plant, then send:
- A stop log export from last week, even from paper or a spreadsheet.
- One shift's counts: planned time, stops, total count and rejects.
- A short phone video of a real stop, such as a jam or a misfeed.
- Your reason codes, so the vendor shows your list, not theirs.
One vendor loads your stop log and shows your top losses. Another says it needs a project first. Both answers tell you something.
What should you watch in each demo?
Five things separate OEE tools on the line. Watch them in every demo, in the same order.
- Time to see a stop. Does it show while the line is still down, or only after the shift?
- Stop reason entry. How many taps, on what screen, in whose words? See what makes OEE software easy to use at the line.
- OEE by line and shift. Are the three factors shown, and does the math match your own OEE calculation?
- Losses in money. Are losses ranked by cost, and can your controller set the rate?
- Proof. What sits behind each stop: a machine signal, a camera clip or a typed note?
Also watch who drives the mouse. A live system can take a click from you. A recorded tour cannot.
How do you score a demo fairly?
Use one scorecard for all vendors, with weights set before the first demo. Each person scores alone, straight after the call, on a 1 to 5 scale with written anchors:
- 1: not shown, or "on the roadmap".
- 2: shown on slides or a video only.
- 3: shown live on the vendor's sample data.
- 4: shown live on your data or your line video.
- 5: shown on your data, and a reference plant with a similar line confirms it.
Then compare. Where two people differ by 2 points or more, talk it through. Write one line of evidence next to each score.
How do you spot demo theatre?
Demo theatre is a demo built to impress, not to inform. Ask to see it, ask to click, and score anything not shown as a 1. The usual signs:
- Slides where there should be live screens.
- "Yes, we can do that" without showing it.
- A stop cause that appears by magic, with no clip, no signal and no operator check.
- A dashboard built only for your demo, which no other customer uses.
- The script skipped "to save time".
A worked example: scoring 3 demos
Sample line (illustrative numbers, not a customer): the filling line of a beverage plant, used for 3 vendor demos in one week. Four people scored each demo: the plant manager, the CI lead, IT and a line lead. Scores are their averages from 1 to 5. The weights total 100 points.
| Criterion | Weight (points) | Vendor A | Vendor B | Vendor C |
|---|---|---|---|---|
| Time to see a stop | 20 | 4 | 5 | 3 |
| Stop reason entry | 20 | 3 | 4 | 5 |
| OEE by line and shift | 20 | 4 | 3 | 4 |
| Losses in money | 15 | 2 | 4 | 4 |
| Worked on our data | 15 | 3 | 2 | 5 |
| Old machine connected | 10 | 4 | 2 | 3 |
| Weighted score | 100 | 3.35 | 3.50 | 4.05 |
- Multiply each score by its weight, add, then divide by 100.
- Vendor A: 80 + 60 + 80 + 30 + 45 + 40 = 335, and 335 / 100 = 3.35.
- Vendor B: 100 + 80 + 60 + 60 + 30 + 20 = 350, and 350 / 100 = 3.50.
- Vendor C: 60 + 100 + 80 + 60 + 75 + 30 = 405, and 405 / 100 = 4.05.
Vendor B gave the best show, but it could not load the plant's stop log. Vendor C was less polished, yet it found the top loss in the plant's own export. A and B are 0.15 apart: a tie, not a ranking. The plant took C to a pilot on one line, with B as the fallback.
Mistakes plants make with OEE software demos
- Letting each vendor run its own script.
- Scoring from memory, after the last demo.
- Counting features instead of watching a stop reach the screen.
- Leaving line leads and operators out of the room.
- Treating a gap of 0.15 as a clear winner.
Where Fabrico fits
Fabrico is a computer vision enabled Manufacturing Performance Platform. OEE and light MES come first, so this is what we would show against your script.
- Automatic downtime logging: the stop reaches the screen from the machine signal.
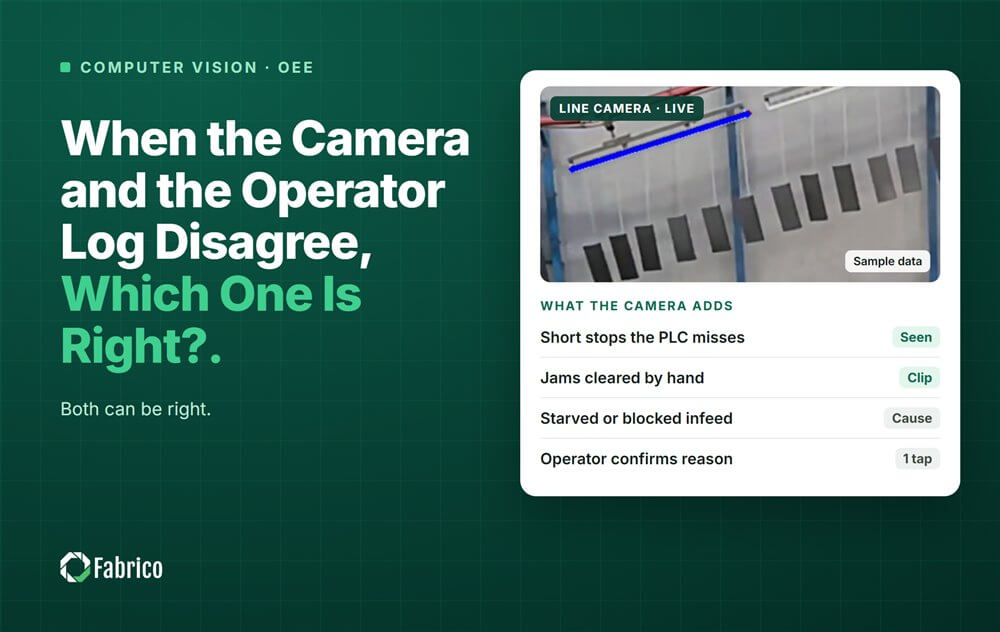
- The operator confirms the reason in one tap: where a camera watches, it suggests a reason and the clip stays as evidence.
- OEE live by line and shift: today's number and its three factors.
- Losses ranked by money: the top loss first, at the rate your controller sets.
You start on one line, with a baseline and a decision date agreed in advance. Devices are connected in about one month, and the full rollout takes 3 to 4 months. There is no free plan and there are no tiers: each plant gets a quote.
See how stops are captured on the computer vision OEE page.
Frequently asked questions
How many OEE software vendors should we demo?
Three is a practical number after a shortlist. Fewer gives you little to compare, and with more the team loses track. Screen the long list on paper first, then demo only vendors that meet your must-haves. Our vendor shortlist guide shows how.
Who should attend OEE software demos?
The people who will score it: the sponsor, the CI or OEE lead, IT/OT and at least one line lead or operator. The line lead knows what the screen means on a busy night shift. Keep the same group for every vendor, so the scores compare.
Can we ask a vendor to use our own data in a demo?
Yes, and you should. Send a stop log export or one shift's counts ahead of the demo, after IT approves what may leave the plant. A vendor that shows your losses on your data has passed the first real test.
How should we score a feature that is on the roadmap?
Score it as not there. Roadmaps change, and you are buying what works today. If it is a must-have, ask for the date in writing. Keep the score at 1 until you see it working on your data. A promise is not a feature.
How long should an OEE software demo be?
Long enough to run your whole script and take questions. Give every vendor the same time box, so nobody wins by talking longer. For reference, the Fabrico demo is a 45 minute conversation with a consultant. Send the script ahead, so the time goes on your questions.
Send us your demo script
Bring your script and one shift of stop data. We will run through it on screen and show your top losses in money.
Latest from our blog
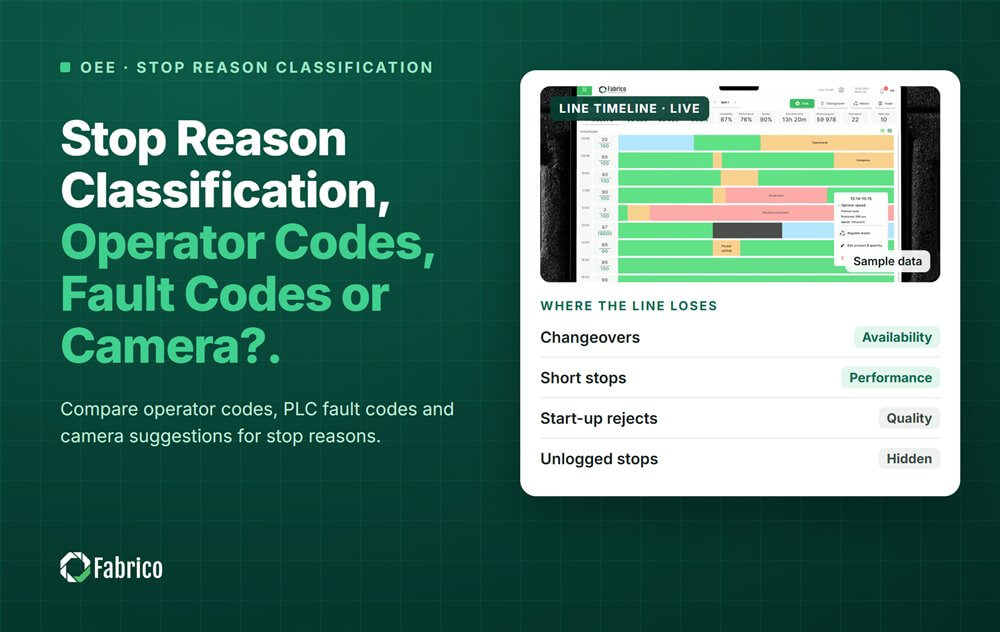
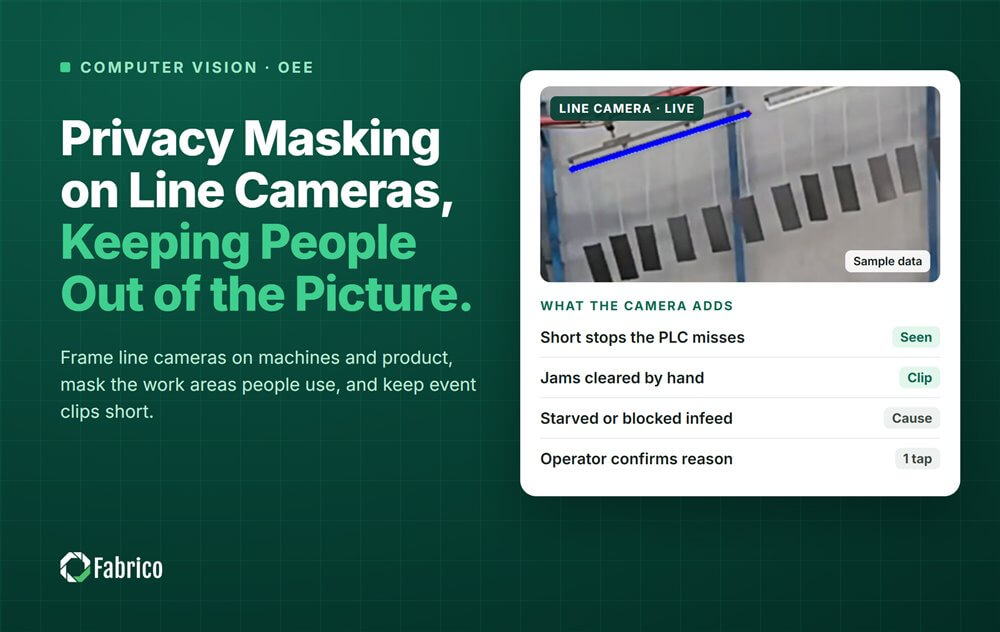
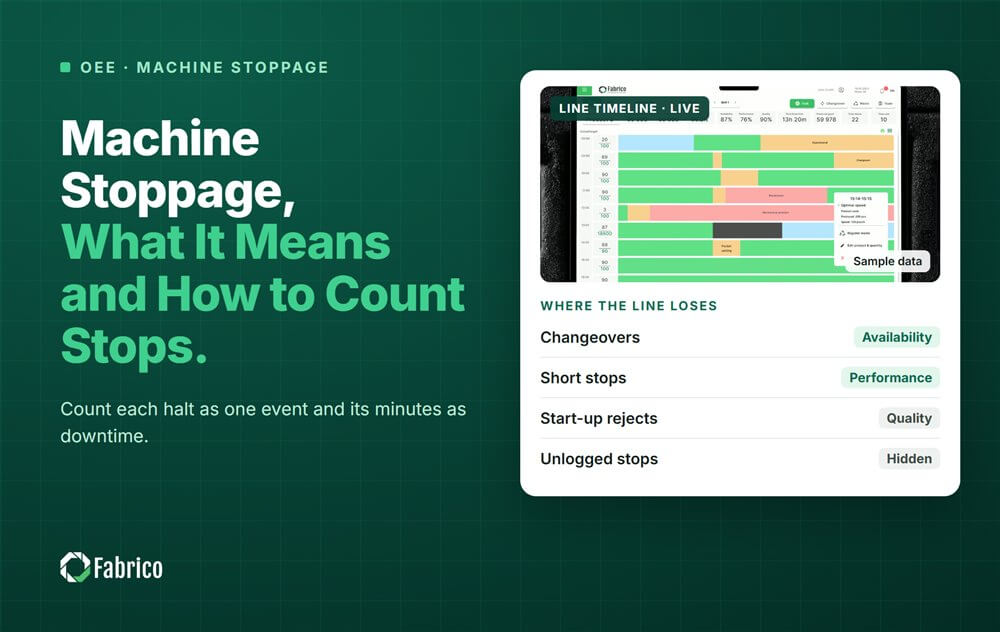


Real Fabrico tiles, sample data.