

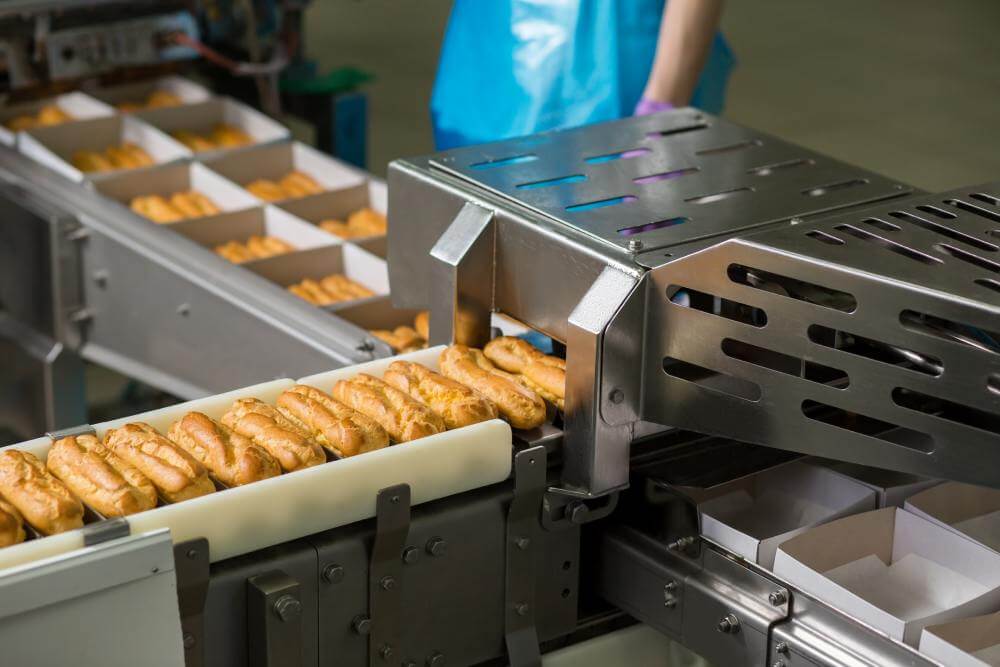

Key takeaways
Generic OEE and CMMS advice assumes a machine that can stop and restart without much harm. A bakery line does not work that way.
Dough keeps fermenting, the oven keeps baking whatever is on the band, and product that waits too long becomes waste. The software you choose has to reflect that.
This guide is for plant, production and maintenance managers running industrial lines for bread, buns, cakes, biscuits, cookies or frozen dough.
It covers what to measure at each stage, how to calculate bakery OEE honestly, what to maintain and how often, what auditors expect to see, and how to choose a system.
A typical bread or bun line runs as one connected flow. Each stage feeds the next, with little or no buffer between them.
Biscuit and cookie lines swap dividing and proofing for sheeting, cutting or rotary moulding, and depositing. The logic below applies to them as well.
The six big losses framework maps well onto a bakery line. The table shows where each loss usually appears.
| Stage | Typical loss | OEE factor |
|---|---|---|
| Mixing | Late batch, dough out of temperature | Availability |
| Dividing | Weight drift, divider stops | Quality, Availability |
| Proofing | Proof time variation, humidity out of range | Quality, Performance |
| Oven | Not at temperature, burner faults, band stops | Availability |
| Oven | Band speed reduced to protect bake | Performance |
| Cooling | Spiral belt faults, product not cool enough to slice | Availability, Performance |
| Slicing | Jams, dull blades, torn slices | Performance, Quality |
| Packaging | Wrapper short stops, film splices, bad seals | Performance, Quality |
| Inspection | Underweight packs, metal detector rejects | Quality |
| Whole line | Changeovers, allergen cleans, sanitation | Availability |
| Whole line | Misshapes, burnt or pale product | Quality |
Overweight is not scrap, but it is giveaway. Track it next to OEE, because a line can hit its quality target while giving away product in every pack.
On a tunnel oven line, the bake time and the band length fix how fast product can move. Everything upstream is set to feed the oven, and everything downstream must clear it.
So take the rated speed from the oven, in pieces per minute for each product. If the wrapper can run faster, that is useful headroom, not a higher target.
Our bottleneck analysis guide explains how to confirm which asset really paces a line.
When a packaging machine stops, product upstream is already mixed, proving or baking. It cannot wait on a shelf like metal parts can.
Dough past its window is scrapped before it reaches any counter. If you only count rejects at the end of the line, that loss disappears from your quality figure.
Record dough scrap in kilograms by cause and stage, and review it next to the stop that caused it.
Moving from a sesame bun to a plain bun, or from a nut product to a nut-free one, needs a validated clean before the next run. That clean can take longer than a normal changeover.
Product sequencing matters, because running allergen-free products first reduces the number of full cleans. See our guide to allergen changeover validation.
This is the decision that most often makes two bakeries' OEE figures incomparable. Make it once, write it down, and apply it on every line.
| Time category | Recommended treatment |
|---|---|
| Scheduled full sanitation between production runs | Planned stop, excluded from planned production time |
| Allergen changeover clean | Availability loss (changeover) |
| Product changeover without allergen clean | Availability loss (changeover) |
| Unscheduled mid-run clean (spill, contamination) | Availability loss (unplanned stop) |
| Oven warm-up before the first product | Availability loss, unless always scheduled before the shift starts |
Excluding the scheduled clean keeps OEE focused on what the team can change during the run. Report sanitation hours separately, so a clean that grows from 40 to 70 minutes is still visible.
Our article on planned vs unplanned downtime covers the general rule, and the master sanitation schedule guide covers the cleaning plan itself.
Here is one shift on a bun line, with round numbers to keep the arithmetic easy to check.
| Item | Value |
|---|---|
| Shift length | 480 minutes |
| Scheduled end-of-shift sanitation | 40 minutes (planned stop) |
| Planned production time | 440 minutes |
| Allergen changeover (sesame to plain, the order that forces a full clean) | 35 minutes |
| Divider stops | 12 minutes |
| Oven temperature recovery after changeover | 8 minutes |
| Run time | 385 minutes |
| Rated speed (set by the oven) | 120 buns per minute |
| Total buns counted at the oven exit | 41,580 |
| Rejects (misshapes, underweight, metal detector) | 1,248 |
| Good buns | 40,332 |
Stops inside planned time were 35 + 12 + 8 = 55 minutes, so run time is 440 minus 55 = 385 minutes.
Availability = 385 ÷ 440 = 87.5%.
At 120 buns per minute, 385 minutes of running should give 46,200 buns. The line made 41,580.
Performance = 41,580 ÷ 46,200 = 90.0%, mostly from a slower band after the changeover and empty gaps on the band after short divider stops. Buns baked while the wrapper was down get hand-packed or scrapped, so wrapper stops show up in quality, not here.
Quality = 40,332 ÷ 41,580 = 97.0%.
OEE = 87.5% × 90.0% × 97.0% = 76.4%.
Check it in one step: 40,332 good buns ÷ (120 × 440 = 52,800 possible buns) = 76.4%.
If the 40 minute clean is left inside planned time, the base becomes 480 minutes and 57,600 possible buns.
OEE then falls to 40,332 ÷ 57,600 = 70.0%, for exactly the same shift. Neither number is wrong, but you must state which one you report.
Note also what the 97.0% hides: dough scrapped at the divider during the 12 minutes of stops never reached the counter. For the full method, see our OEE calculation guide.
Most bakery breakdowns come back at the same few places. The table lists the usual ones and a sensible trigger for each.
| Asset | What to check or maintain | Typical trigger |
|---|---|---|
| Oven burners | Flame, ignition, combustion settings, filters | Calendar, by specialist |
| Oven band | Tracking, tension, joints, drive and bearings | Run hours, weekly visual |
| Proofer | Humidity and temperature sensors, chains, trays | Calendar, sensor calibration |
| Spiral cooler or freezer | Belt wear, drive, tracking, fans, defrost | Run hours, condition |
| Divider | Pistons, knives, weight accuracy | Run hours, weight trend |
| Slicer | Blades, blade guides, tension | Hours or tonnes sliced |
| Flow wrapper | Seal jaws, temperature, film path, knives | Cycles, seal failures |
| Metal detector | Verification with test pieces, reject function | Start, end, product change, set interval |
| Checkweigher | Calibration, reject function | Calendar, daily check |
| Chains and bearings | Lubrication with H1 food-grade lubricant | Run hours, lubrication route |
Metal detector checks usually pass ferrous, non-ferrous and stainless steel test pieces through the detector and confirm the reject works. Metal detection is usually a CCP, so a failed check means holding everything made since the last good check.
Where incidental food contact is possible, use lubricants registered as NSF H1. Our guide to H1 vs H2 food-grade lubricants explains the difference.
Most plants use a mix. Our preventive maintenance schedule guide shows how to build one, and how to reduce machine downtime covers what to fix first.
Bakeries that supply retailers are usually certified to a scheme such as BRCGS Food Safety, IFS Food or FSSC 22000, built on a HACCP plan. Each has its own clauses, so read your scheme's current issue for the exact wording.
What they have in common is that auditors look for documented evidence, and much of it lives in maintenance records.
| Audit topic | Evidence your records should support |
|---|---|
| Planned maintenance | A plan per asset, completed tasks, dates, who did them |
| Hygiene after engineering work | A clearance signed by QA or production, not the engineer, before restart |
| Temporary repairs | What was done, when it will be fixed properly |
| Glass and brittle plastic | A register of items and routine condition checks |
| Foreign body control | Metal detector checks, blade and sieve inspections |
| Lubricants and chemicals | Which H1 products are used, and where |
| Pest-proofing | Repairs to doors, seals, gaps and screens, with dates |
| Calibration | Checkweigher, probes and sensors, with results |
A record that says "fixed" with no date, no name and no restart check is weak evidence. A work order with the task, the parts used, the time and the sign-off is strong evidence.
Our HACCP compliance guide goes deeper on prerequisite programmes and records.
Ask every vendor the same questions, and ask them to show the answer on a real line, not a slide.
For a wider comparison, see our guide to the best CMMS for food and beverage.
For the meat side of food manufacturing, with wash-down, slicing and giveaway, see our guide to OEE and maintenance software for meat and poultry plants.
Fabrico is an OEE platform with a full CMMS built in.
It collects machine data through PLC connections, IoT sensors and computer vision cameras. Camera counting suits packaging and wrapping lines where PLC access is difficult.
It calculates availability, performance, quality and OEE in real time, and detects short stops that manual logs miss.
On the maintenance side, your team creates work orders, builds preventive plans with recurring templates, and scans QR codes on machines and parts from the iOS, Android or web app.
Every job keeps a documented history of who did what, when and with which parts, which is part of the evidence auditors ask for. Inventory tracks spare parts with minimum and maximum levels.
Want to see it on a line like yours? Book a 30 minute demo with a Fabrico consultant, no commitment, or contact us with your questions.
There is no reliable bakery benchmark, because results depend on product mix, changeovers and how sanitation is treated. Compare each line with itself over time, using the same rules.
Treat scheduled full sanitation between runs as a planned stop and report its hours separately. Count allergen changeovers and unscheduled cleans as availability losses.
On most bread and bun lines it is the oven, because bake time and band length fix how fast product can move. Use the oven's rate for each product as the line's rated speed.
At the frequency your HACCP plan sets, commonly at the start and end of production, at product changes and at regular intervals. Each check with test pieces should be recorded.
Quality is usually counted at the end of the line, so dough scrapped upstream after a stop never reaches the counter. Record dough scrap by weight and stage alongside OEE.


















 Вход
Вход
 Блог
Блог

