


 Login
 Blog

Lean Implementation Plan: A 12-Month Roadmap Sequenced by OEE Loss

In short: a lean implementation plan works when the losses you measure choose the pilot line and the first tool, and each step has an exit test in numbers. Plan one year: a baseline month, two loss projects on a pilot, a copy to similar lines, then bank the gain.
- Measure first: four weeks of OEE from the machine signal, with stop reasons, before any workshop.
- Let the loss tree pick the tool: SMED for changeovers, standard work for speed, TPM basics for breakdowns.
- In the worked example one closures press goes from 58.3% to 65.8% OEE, worth EUR 42,074 a year at a gross-margin floor.
- The pilot alone barely pays for a CI lead. The copy to similar lines is where the money is, so plan gate 3 from day one.
A lean implementation plan can fail quietly. The kick-off goes well, 5S boards go up, a few kaizen events run, and a year later the plant's output per hour is where it was. The plan was a calendar of tools, not a sequence of losses.
This guide is for the plant manager or CI lead who has to write the plan and defend it to finance. It sets out a 12-month lean implementation roadmap where measured OEE losses pick the pilot line and the first tool, gives each gate an exit criterion in numbers, prices one injection-moulded closures press from month 0 to month 12, and compares four ways to staff the programme.
What a lean implementation plan has to decide first
Before any tool, the plan answers five questions. Everything else in the document, from the training schedule to the steering group, supports these:
- Where is the loss today? A baseline per line, split into availability, performance and quality, and into causes inside each.
- Which line goes first? One pilot with a large loss whose machines, moulds or products other lines share.
- Which tool goes first? The one that attacks the biggest loss on that pilot, not the one the last consultant liked.
- How do you know a step worked? An exit criterion per gate: the targeted loss down by a set share, held for four weeks.
- Where does the gain go? More volume sold, fewer shifts, or a machine you no longer need to buy. Finance has to agree on this in month one.
Lean principles and the tool kit are covered elsewhere: lean manufacturing principles and lean manufacturing tools. If you have not yet scored where the plant stands, run the lean assessment checklist first; this roadmap is the step after it.
Why the measured loss tree should pick the first tool
Opinion can pick the wrong first tool, because the loudest loss is not always the biggest. Stops are visible; slow cycles and short stops are not. A study of OEE data from 98 Swedish companies, 2006 to 2012 found that operational efficiency losses had the largest impact on OEE, followed by availability losses. Slow cycles and short stops sit on that efficiency side. A plan that opens with changeover workshops because changeovers are the visible pain can spend six months on the second-biggest problem.
The fix is to put every loss on one scale: minutes of ideal time lost. A 20-minute stop costs 20 minutes. A cycle running at 4.6 seconds instead of 4.0 costs 13% of every running minute. Rejects cost the minutes it took to make them. Add the six causes up and they equal planned time minus the time it would have taken to make the good output at the ideal rate, so nothing is counted twice.
Read the tree as families, not single bars. In the worked example below, mould and colour changes are the biggest single cause, but short stops and slow cycles together are bigger. That is why speed goes first on the pilot and SMED second. For the split between those two, reduced speed loss vs minor stops shows how to tell them apart in the data, and six big losses vs seven wastes maps the OEE losses to the lean wastes your team already knows.
Getting the tree takes four weeks of data per line with stop reasons attached. OEE software that reads the machine signal records when each press stops and runs, and how fast it cycles; operators choose the stop reason on a tablet or phone at the line from a short grouped list. Four weeks of that is a report, not a study. The walkthrough below shows a shift timeline and how unclassified stop time waits for a reason.
What you see: a shift timeline, unclassified time waiting for a reason, and the operator's line-down screen, on sample lines. Book a demo.
Plays from YouTube. Google may set cookies when you press play. Privacy policy.
The reason list matters more than the screen. Keep it short enough that operators use it, and split the reasons the roadmap will need later, such as mould change versus colour change; downtime reason code design covers how. A good test before gate 0 closes: at least 90% of stop time on every line carries a reason.
The 12-month roadmap: five gates and their exit criteria
Each gate is a review where the plant manager decides go, repeat or stop, on numbers agreed in advance. The months are a sample timeline for a plant with one CI lead and a willing pilot team; a plant with more people moves faster, one with weaker data spends longer at gate 0.
- Gate 0, month 1: baseline: Machine-signal OEE on every press for four weeks, 90% of stop time with a reason, a loss tree per press.
- Gate 1, month 4: first loss on the pilot: The leading loss down by a set share and held for four weeks, with a written standard.
- Gate 2, month 6: second loss on the pilot: The next loss in the tree attacked the same way; pilot OEE up and holding.
- Gate 3, month 9: copy to similar lines: The pilot standards running on the lines that share its moulds, products or machines.
- Gate 4, month 12: bank and plan year 2: The gain turned into money (sold volume, dropped shifts or a deferred machine) and a new loss tree.
| Gate | When | Work | Exit criterion |
|---|---|---|---|
| 0. Baseline | Month 1 | OEE on every line from the machine signal; reason list; loss tree per line; pilot chosen | 90% of stop time classified; finance agrees how gains are valued |
| 1. First loss | Months 2 to 4 | Tool for the biggest loss family on the pilot (speed in the example: standard settings, short-stop fixes) | That loss down by the agreed share, held 4 weeks, standard written |
| 2. Second loss | Months 5 to 6 | Next loss in the tree (changeovers in the example: SMED) | Changeover minutes down by the agreed share; pilot OEE holding |
| 3. Copy | Months 7 to 9 | Pilot standards copied to lines that share moulds, products or machines; TPM basics where breakdowns lead | Copied lines show the same loss falling; pilot still holding |
| 4. Bank and plan | Months 10 to 12 | Gain converted: volume sold, shifts dropped or a machine deferred; new loss tree for year 2 | Money in the management accounts; year 2 plan signed |
Two rules keep the roadmap honest. First, each gate attacks one loss family on one line before anything spreads; parallel workshops on five tools dilute the team and make it impossible to say what worked. Second, a gain only counts once it has held for four weeks after the event. The US EPA guide to kaizen describes events that run for between one day and seven days, with changes often made within 72 hours, and follow-up events, sometimes scheduled at 30 and 90 days, to check the gains held. Put those follow-ups in the calendar at gate 1, not as an afterthought.
Kaizen events are the engine inside gates 1 and 2. If you already run them, using OEE data to run kaizen events with proof shows how to set the before-and-after, and why kaizen events fail lists the traps. For the daily rhythm that holds the gains, short tier meetings at the line review yesterday's losses against the gate target.
Worked example: one closures press from 58.3% to 65.8% OEE
Sample figures for illustration only. A plant in Poland moulds 28 mm beverage caps on six presses. Press 4 runs a 48-cavity mould with an ideal cycle of 4.0 seconds, so 720 caps a minute at the ideal rate. It runs three shifts of 450 planned minutes for 21 days a month: 28,350 planned minutes and an ideal output of 20,412,000 caps a month. The pilot was chosen because presses 1 to 3 run the same mould family, so anything that works on press 4 can be copied.
Four weeks of machine-signal data give this month 0 picture:
- 30 mould and colour changes at 104 minutes each, 3,120 minutes; breakdowns 2,100 minutes; start-up and waiting for material or QC release 1,300 minutes. Stop time 6,520, run time 21,830, availability 21,830 / 28,350 = 77.0%.
- Inside run time, 2,160 minutes of short stops (robot pick misses, caps sticking on the ejector) and an average cycle of 4.6 seconds instead of 4.0. Output 12,315,130 caps against 15,717,600 at the ideal rate: performance 78.4%.
- Rejects: 9,000 start-up caps after each change plus 150,000 from checks, 420,000 in all. Good output 11,895,130: quality 96.6%.
- OEE = 77.0% x 78.4% x 96.6% = 58.3%, which is also good output divided by ideal output.
| Loss, minutes of ideal time a month | Month 0 | Month 12 | What changed |
|---|---|---|---|
| Changeovers | 3,120 | 2,100 | SMED, gate 2: 104 to 70 minutes a change |
| Breakdowns | 2,100 | 1,900 | TPM basics on the copy, gate 3 |
| Start-up, waiting | 1,300 | 1,200 | Material staged before the change |
| Short stops | 2,160 | 1,600 | Gripper and ejector fixes, gate 1 |
| Slow cycles | 2,566 | 2,394 | Standard settings sheet: 4.6 to 4.5 s |
| Rejects | 583 | 500 | Start-up recipe: 9,000 to 7,000 caps a change |
| OEE | 58.3% | 65.8% | A 81.7%, P 82.7%, Q 97.4% |
The loss tree says speed first: short stops and slow cycles together cost 4,726 minutes a month, more than the 3,120 minutes of changeovers. So gate 1 writes a standard settings sheet per mould (barrel and mould temperatures, hold time, robot timing) and fixes the two short-stop causes. Gate 2 runs SMED on the changes. Gate 3 copies both to presses 1 to 3 and starts operator checks on the hot runner, where breakdowns cluster.
By month 12 press 4 makes 13,432,000 good caps a month instead of 11,895,130: 1,536,870 more. The money depends on what the plant does with them:
- Sold out, as in the summer peak for beverage caps: at a sample price of EUR 9.40 per 1,000 caps and the NYU Stern gross margin of 24.27% for packaging and container firms (19 US firms, January 2026), each 1,000 caps adds at least EUR 2.28. That is EUR 3,506 a month and EUR 42,074 a year. Gross margin is a floor here, because contribution sits above it: most of the labour and overheads are paid anyway.
- Flat demand: today's output now needs about 54 fewer press hours a month, 7.2 shifts. That is capacity to sell, or weekend shifts to drop.
Copying it to the other five presses
Presses 1 to 3 share the mould family, so assume they gain 5 OEE points each; presses 5 and 6 are older and run other caps, so assume 3. With the pilot's 7.5 points, the six presses gain 28.5 OEE points between them, about 5,823,390 good caps a month. Sold, that is EUR 159,424 a year at the same margin floor. If demand is flat, it frees about 211 press hours a month at a 64% plant OEE, or 4.7 weekend shifts across six presses. With a crew of four at the Destatis figure of EUR 17.10 an hour for manufacturing in Poland (labour cost per hour worked, 2025), each weekend shift costs EUR 547.20, so dropping them saves about EUR 30,735 a year, before energy, wear and any overtime premium.
What if the gains come in smaller
Say the settings sheet only gets the cycle to 4.55 seconds, short stops fall to 1,870 minutes, and SMED stalls at 85 minutes a change. Press 4 then reaches 62.8%, 929,573 more good caps a month and EUR 25,449 a year sold. The order of the gates does not change, which is the point of choosing by the loss tree: a smaller gain on the right loss still beats a large effort on the wrong one.
Who runs it: in-house, a consultant, a public programme or a mix
The tools are well known; the choice that decides most roadmaps is who drives them. These are year-one ranges for a plant like the example. Internal hours use the Destatis manufacturing labour cost per hour worked in 2025, from EUR 10.20 in Bulgaria to EUR 55.00 in Denmark, as a floor (an engineer costs more than the average employee). Consultant days are a labelled sample; get quotes.
| Option | Year-one cost range | Choose it if | Watch out for |
|---|---|---|---|
| In-house CI lead plus a pilot team | 2,262 hours: EUR 23,072 to 124,410; EUR 38,680 in the Polish example | You have someone who has run SMED and standard work before, and the plant manager will protect their time | The CI lead becomes the reporting clerk; gates slip when production is busy |
| External lean consultant | Sample 30 to 60 days at EUR 800 to 1,600: EUR 24,000 to 96,000, plus the team's 552 hours | Nobody inside has run a lean programme, or the plant needs an outside voice to move a stuck management team | Gains that fade when the days run out; ask how they hand over |
| Public programme | Subsidised advice; ask the centre for its terms, plus your team's hours | You are a small or mid-size plant and want structured help without a full consulting contract | Waiting lists, and advisors who cover many topics; check their lean track record |
| Mix: consultant for gates 0 to 2, in-house after | 13 to 20 days, the team and a half-time CI lead: EUR 34,460 to 56,060 in the example | You want speed in the first six months and ownership after | Agree the handover at gate 2 in the contract, not at the end |
Public help exists on both sides of the Atlantic. In the US, the NIST Manufacturing Extension Partnership has nearly 1,400 manufacturing advisors and experts at more than 450 service locations, serving small and mid-size manufacturers in all fifty states and Puerto Rico. In the EU, the European Digital Innovation Hubs offer test-before-invest services, training and financing advice for digital projects; the first call chose 136 projects and a second call added 15 hubs, with funding split 50/50 between the Digital Europe Programme and member states. EDIHs focus on digital technology, so ask whether a hub can help with the measurement side of the roadmap rather than the lean coaching itself.
Who should pick which. The plant manager owns the choice, because they own the gates. Finance should see the payback test before signing: in the example, the pilot alone (EUR 42,074 a year) barely covers an in-house CI lead and team (EUR 38,680), while the pilot plus the copy to five more presses (EUR 159,424) pays for any option on the table. If your plant has no lines to copy to, the case is weaker and a lighter, in-house plan is the honest choice.
Questions to ask before you sign anything:
- To a consultant: which loss did your last three clients attack first, and how did you choose it?
- To a consultant or programme: what does the handover look like at month six, and who writes the standards?
- To finance: will a gain count as sold volume, dropped shifts or a deferred machine, and who signs that off?
- To your own team: who protects the pilot team's two hours a week when production is behind?
- To an OEE software vendor: how do stop reasons get entered at the line, and how does the loss data leave the system for finance?
- To yourself: which lines can copy the pilot, and what stops that copy at gate 3?
Who owns what: plant manager, CI lead and production manager
Roadmaps stall when everyone owns everything. Split it like this:
Plant manager, the sponsor. Chooses the pilot from the loss tree, chairs every gate review and decides go, repeat or stop on the agreed numbers. Gets finance to agree in month one how a gain becomes money. Walks the pilot line every week and asks about the gate target, not the tool. Protects the pilot team's time when the order book is full.
CI lead, the engine. Builds the loss tree per line and keeps the reason list clean. Plans and runs the kaizen events inside gates 1 and 2, books the 30 and 90-day follow-ups, and writes the standards with the people who will use them. Prepares each gate review: the targeted loss, before and after, four weeks of holding data, and what goes next.
Production manager and shift leaders, the keepers. Run the daily review at the line: yesterday's top losses against the gate target, in ten minutes. Make sure stop reasons are entered on every shift. Train the next shift on a new standard before the CI lead moves on. Raise the alarm when a gain starts to slip, which in the data looks like the targeted loss creeping back for two weeks in a row.
Maintenance and engineering join at gate 2 and 3: SMED needs their tools and quick connectors, and breakdown work needs their checks. For the operator side of that, autonomous maintenance sets out the basic checks, and SMED the changeover method. Keep their part tied to the loss on the gate, not a separate programme.
Why lean programmes stall, and the early sign in the data
The research points to people before tools. A 2024 study of critical failure factors for sustainable Lean Six Sigma in Indian manufacturing identified eighteen factors from the literature and expert opinion, and grouped failure of leadership to inspire and motivate, lack of a well-defined framework for executing initiatives, and high implementation cost with poor cost estimation as the three top-management-level factors; its ranking put misalignment between CI initiatives and company goals first. A Loughborough University review of lean barriers and enablers sorted them into seven organisational elements across technical and cultural aspects. The table turns that into what you will see on the floor first.
| Failure mode | Early sign in line data | Fix |
|---|---|---|
| Tool-first rollout: 5S and boards everywhere in month 1 | Audit scores rise while OEE on every line is flat | Stop the spread; pick one pilot and one loss from the tree |
| Baseline from paper logs | OEE jumps or drops 10 points the week machine data starts | Restart gate 0 on machine-signal data; value nothing from the paper baseline |
| Gains that fade after the event | Targeted loss back to its old level within 4 to 8 weeks | Book the 30 and 90-day follow-ups; the shift leader owns the standard |
| Pilot that never spreads | Pilot OEE up, plant OEE flat at month 9 | Choose pilots with copyable machines or moulds; make gate 3 a hard date |
| Leaders absent from the line | Daily reviews skipped; share of stop time with a reason falls | Plant manager walks the pilot weekly; review attendance is a gate item |
| Gains never banked | OEE up, but overtime and shift count unchanged | Agree the money rule with finance at gate 0; check it at gate 4 |
Most of these show up in the numbers months before they show up in a steering meeting. That is the strongest argument for making the loss data automatic: a programme that has to stop to collect its own evidence will stop collecting it.
The first 30 days: a start list for the CI lead
- Connect every line in scope so stops, run time and counts come from the machine signal, not a clipboard.
- Agree a short reason list with the shift leaders; split the reasons the roadmap will need, such as mould change versus colour change.
- Agree with finance how a gain will be valued: price and margin per product family, or crew cost per shift dropped.
- After two weeks, check that at least 90% of stop time carries a reason; fix the list where it does not.
- After four weeks, build the loss tree per line in minutes of ideal time.
- Pick the pilot: a big loss, copyable machines or products, and a team leader who wants it.
- Name the first loss family and the gate 1 exit criterion, in numbers, in writing.
- Book the gate 1 review, the first kaizen event and its 30 and 90-day follow-ups in the calendar.
If you want a shorter, OEE-only version of the same idea for one line, the 90-day OEE improvement program sets out what a plant manager should see each Monday.
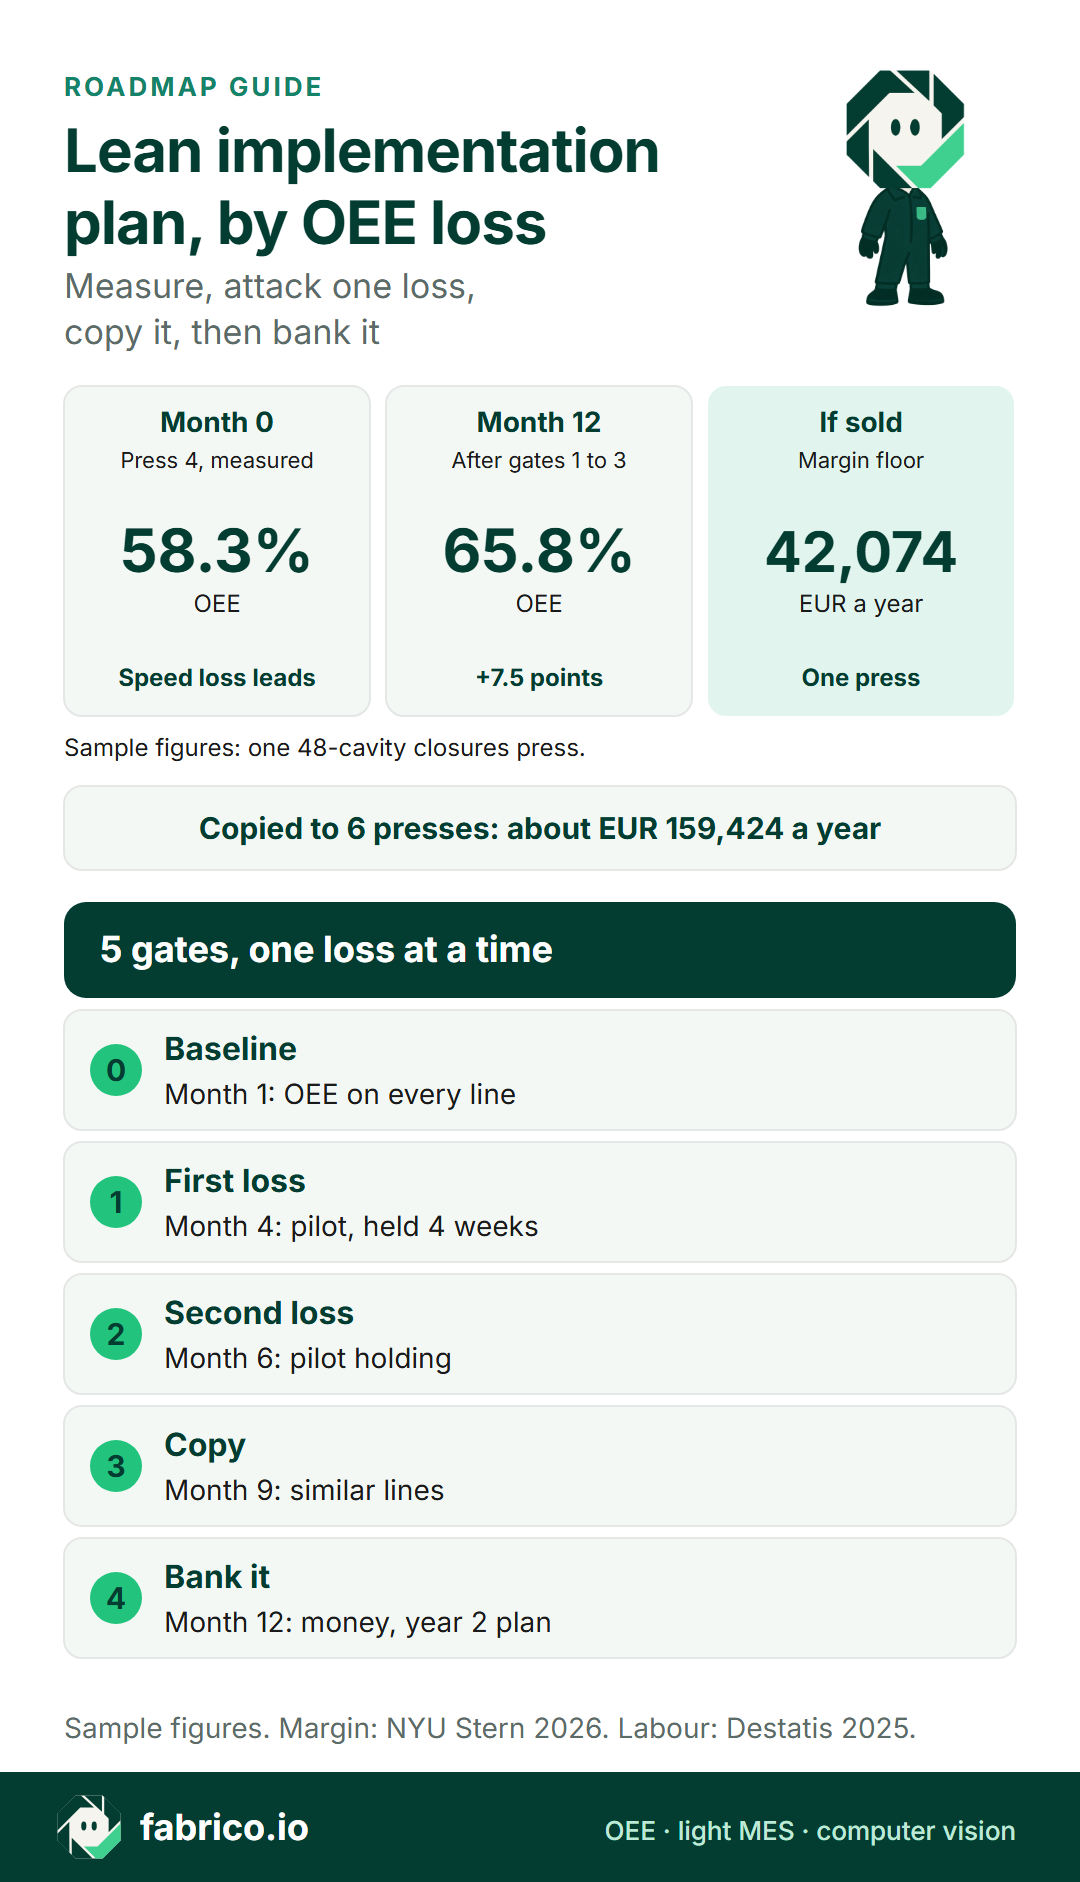
Text version of this infographic
- Press 4, month 0: OEE 58.3%.
- Press 4, month 12: OEE 65.8%.
- Gain if sold: EUR 42,074 a year for one press, about EUR 159,424 across six presses.
- Gate 0, Baseline: Month 1: OEE on every line.
- Gate 1, First loss: Month 4: pilot, held 4 weeks.
- Gate 2, Second loss: Month 6: pilot holding.
- Gate 3, Copy: Month 9: similar lines.
- Gate 4, Bank it: Month 12: money, year 2 plan.
- Sample figures. Margin: NYU Stern, January 2026. Labour: Destatis 2025.
Where Fabrico fits in a lean roadmap
Fabrico is light MES and OEE software for the plant floor. It does not run your lean programme; it supplies the loss data each gate is judged on:
- A PLC or an IoT device with sensors on each press supplies run time, stop time and counts. At the press, the operator gives long stops a cause from a short grouped list on a tablet or phone, so mould changes, colour changes and short stops land in separate rows. Screens are on the OEE and light MES solution page.
- OEE and its losses by machine, line and shift, priced from the prices and margins you enter, so a gate review sets the targeted loss before and after side by side in euros.
- For plastics plants, OEE software for injection molding and MES for plastics injection moulding compare the options for presses.
- On manual packing or assembly stations with no usable signal, the camera add-on counts output; see MES and OEE with computer vision and computer vision for plastics injection molding. Where the camera add-on covers the station, the video for the minute of a stop can be opened from the shift timeline, streamed on request and not stored in Fabrico.
- The loss tree can go to the CI lead's workbook or finance's model by Excel or CSV export, webhooks or the REST API.
To compare tools built around lean programmes, see lean manufacturing software and kaizen and continuous improvement software.
Sources, accessed 16.11.2026: Ylipää et al. 2017, Chalmers; US EPA, kaizen; NYU Stern margins by sector; Destatis, EU labour cost per hour worked; NIST MEP; European Commission, EDIHs; Frontiers in Mechanical Engineering 2024, LSS failure factors; Leite, Bateman and Radnor, Loughborough.
Questions CI and plant managers ask about lean roadmaps
What should a lean implementation plan include?
Five things: a measured baseline, a pilot line chosen by its losses, the first tool chosen by the biggest loss on that line, gates with exit criteria in numbers, and a rule for how gains are banked. Training plans, communication and governance support those five; without them the plan is a calendar of workshops.
How long does a lean implementation take?
A first cycle on one pilot line and its copies fits in about a year, with a review every two to three months. Lean itself has no end date: each year starts with a new loss tree. Rolling every tool out to every line in year one spreads the team too thin to show what worked.
Which lean tool should come first?
The one that attacks the biggest measured loss on the pilot line. If changeovers lead, start with SMED; if short stops or slow cycles lead, start with standard work and machine settings; if breakdowns lead, TPM basics; if scrap leads, a start-up standard. 5S and visual management support all of them.
How do you choose the pilot line for lean?
Pick a line with a large, measured loss, a product or machine family that other lines share, so the standards can be copied, and a team leader who wants it. Avoid the line that is already best, and the one that is about to be replaced.
How do you measure whether a lean programme is working?
Track OEE with its availability, performance and quality parts on the pilot line, plus the specific loss the current gate attacks, every week. A programme is working when the targeted loss falls, the gain holds for four weeks after the event, and the money shows up as sold volume or dropped shifts.
Why do lean implementations fail?
Research on lean and Lean Six Sigma failures points to people and strategy before tools: initiatives not aligned with company goals, leaders who do not inspire or stay involved, no clear framework for running them, and costs that were poorly estimated. On the floor the early sign is a pilot whose gains fade after the consultants leave, or one that never spreads.
Want to see a loss tree per line built from machine data, with stop reasons from the floor? Book a demo.
Related articles





Latest from our blog






Real Fabrico tiles, sample data.