


 Login
 Blog
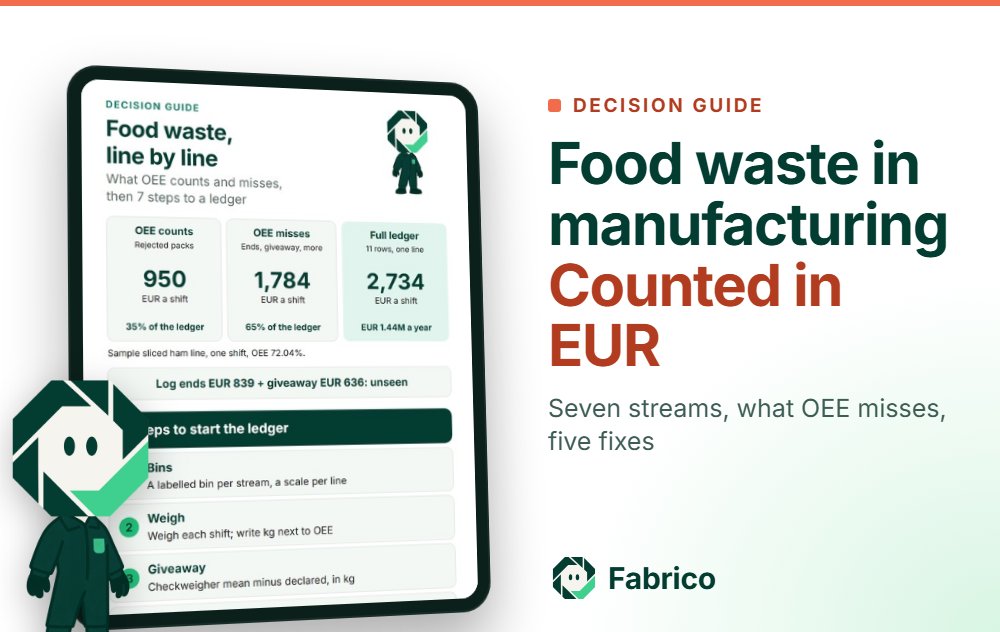
Food Waste in Food Manufacturing: A Ledger by Line and Cause

In short: food waste in food manufacturing is the food that enters a plant and leaves as anything other than saleable product. On a line it comes in seven streams: start-up scrap, giveaway, checkweigher and metal-detector rejects, trim, end-of-run purge, CIP or clean-down loss, and damaged packs. OEE quality counts only packs that were counted and then rejected, so on the sample line below, about two thirds of the waste by weight and by money sit outside it.
- Weigh each stream by line and shift, next to OEE, and close the mass balance.
- On the worked sliced ham line, OEE quality sees EUR 950.13 of a EUR 2,734.13 shift ledger: 35%.
- Fix start-up scrap and giveaway first, move safe trim to a second product, then price capex.
- The EU asks Member States to cut processing and manufacturing food waste by 10% by 2030.
Ask a food plant how much food it wastes and the answer usually comes from the waste contractor's invoice: tonnes a month, for the whole site. That figure cannot say which line, shift or cause. The waste is made on the lines, a few kilograms at a time, and only some of it reaches the OEE report.
This guide, for production, CI and plant managers in meat, bakery, ready meal and sauce plants, sets out a ledger by line and cause, sorts what OEE quality counts from what it misses, and costs one sliced cooked ham line in kilograms and euros.
How much food a factory wastes, and what the figures leave out
The European Commission food waste page, quoting Eurostat figures published in 2026, puts EU food waste at around 58 million tonnes a year, 129 kg per inhabitant. The manufacture of food products and beverages produced 19% of it, 25 kg per inhabitant, second only to households at 53%.
In the UK, WRAP key facts from July 2025 (data for 2021 and 2022) put food waste at 10.2 million tonnes, 13% of it from manufacturing. That is 3.8% of the food manufacturers handle, against 0.44% in retail, and the edible part, 706,000 tonnes in 2021, was worth GBP 0.85 billion at 2021 prices.
Global reporting calls the same kilograms food loss: under SDG target 12.3, the FAO Food Loss Index covers production up to, but not including, retail. FAO estimates that 13.3% of food was lost after harvest in 2023, processing included; Northern America and Europe report 10.0%, and meat and animal products 14.0%.
The EU now has a number for factories. The 2025 amendment of the Waste Framework Directive requires Member States to cut food waste in processing and manufacturing by 10% by 2030, against the annual average for 2021 to 2023.
Inside one site, the losses are uneven. A 2026 open-access study of UK prepared sandwich manufacture (Brunel University and partners, npj Science of Food) measured a loss rate of 13%, 97% of it valorised, with hotspots in product assembly and ingredient preparation. A site total hides the step that leaks.
The food-waste ledger: seven streams on a food line
A ledger records, per line and shift, the kilograms that left as anything other than saleable product, and why. Seven streams make it up:
- Start-up scrap after changeovers: set-up slices, the first trays of dough, the first fills of a sauce run. Some becomes packs that are counted and binned; some never reaches the counter.
- Giveaway and overfill: product packed above the declared weight to stay inside the average quantity rules.
- Checkweigher and metal-detector rejects: packs pushed off for weight, a suspected foreign body, or a seal or label fault.
- Trim and offcuts: log ends on a slicer, dough edge trim, cake edges. They never become units.
- End-of-run purge: what is left in the machine at a run end, such as a part log or sauce in the pipes.
- CIP and clean-down loss: product pushed out with water at a CIP, or scraped from belts at a dry clean-down.
- Damaged packs: crushed or leaking packs found at the case packer, in the chiller or at dispatch.
Add the line's input in kilograms and the ledger closes as a mass balance: product in equals product packed plus the streams. A gap of more than a percent or two points to a stream nobody weighs. The yield loss in manufacturing guide covers the general measure; the ledger keeps it in kilograms of food, by cause.
Record where each stream goes, too. The US EPA's Wasted Food Scale puts prevention first, as the most environmentally beneficial option. Meat lines also have a legal floor. Under Article 10 of the animal by-products regulation, Regulation (EC) No 1069/2009 (legislation.gov.uk copy, retained in Great Britain), animal products no longer intended for human consumption for commercial reasons, or because of manufacturing or packaging defects with no health risk, are Category 3 material, handled under that regulation rather than as general waste. Check the text in force where your plant is.
What OEE quality counts, and what it never sees
OEE quality is good count divided by total count. A stream enters that maths only if it was counted as a unit and then failed. Trim, purge and clean-down loss never become units, while giveaway and packs damaged after the good count are counted as good.
| Stream | In OEE quality? | Where it hides | How to add it |
|---|---|---|---|
| Start-up scrap | Packs yes; product before the first pack no | Changeover minutes | Weigh the start-up bin per changeover |
| Giveaway, overfill | No: the packs are good | Checkweigher mean weight | Mean minus declared weight, times good packs |
| Checkweigher and metal-detector rejects | Yes | Mixed with other rejects | One count per reject source; weigh the bins |
| Trim and offcuts | No | Raw material usage variance | Weigh per shift against a standard per log or batch |
| End-of-run purge | No | Gap between batch input and output | Weigh per run end; tie it to run length |
| CIP and clean-down loss | No | Planned clean time, outside OEE | Weigh or meter the product pushed out |
| Damaged packs | Before the good count yes, after it no | Dispatch and returns | Book them back to the line and shift |
Sibling guides cover single rows: giveaway and overfill, checkweigher rejects in OEE quality, startup loss vs reduced yield loss for the counted start-up packs, and CIP time in OEE for the minutes of a clean.
The sort matters because the quality factor ranks lines the wrong way: a line at 97% quality can waste more food than one at 94% if its losses sit in trim, which OEE quality never sees.
Worked example: one sliced ham line, one shift, the full ledger
Sample figures for illustration only. An EU plant slices cooked ham logs into 150 g fixed-weight packs: slicer, thermoformer in modified atmosphere, checkweigher, metal detector, labeller and case packer. The thermoformer is the constraint at 11 cycles of 6 packs a minute, 66 packs. A 480-minute shift ends with a 25-minute planned clean-down, so planned time is 455 minutes and the ideal is 455 x 66 = 30,030 packs.
Availability: a changeover between two retailer specs takes 34 minutes, short stops for film splices, label jams and slicer faults 38, and waiting for tempered logs 14. Run time is 455 minus 86 = 369 minutes: 81.10%. Performance: 369 x 66 = 24,354 packs possible, 22,430 counted: 92.10%. Quality: 796 packs come off before the case packer (184 start-up packs, 395 checkweigher rejects, 8 metal-detector rejects, 209 leakers and crushed packs), leaving 21,634 good: 96.45%. OEE is 81.10% x 92.10% x 96.45% = 72.04%, the same as 21,634 / 30,030; the OEE calculation guide shows the method.
OEE has counted 796 lost packs, 119.40 kg of ham. The ledger finds the rest:
- Giveaway: checkweigher mean 154.3 g on 150 g packs: 4.3 g x 21,588 shipped packs = 92.83 kg; the 46 packs damaged after the count carry their own giveaway in the damaged row.
- Set-up slices: 6.5 kg at the shift start and again after the changeover: 13.00 kg.
- Log ends: 753 logs of 4.8 kg, each with a 0.16 kg end the slicer cannot cut: 120.48 kg.
- Purge and clean-down: 3.4 kg at each of two run ends, and 4.90 kg from belts, forming station and floor.
- Damaged after the count: 46 packs found in the chiller and at dispatch, 7.10 kg, all counted as good.
The mass balance: 753 x 4.8 = 3,614.40 kg in; 3,457.53 kg out in packs; 24.70 kg of set-up slices, purge and clean-down; 120.48 kg of ends. That leaves 11.69 kg nobody can place, which gets a row of its own.
The prices are labelled samples: ham at EUR 6.85 a kg, EUR 0.064 of tray, film, gas and label a pack, and EUR 0.11 a kg for Category 3 collection. A lost pack also needs a replacement: a crew of 7 at the Eurostat 2025 average hourly labour cost for the EU, EUR 34.9 for the whole economy, costs EUR 244.30 an hour, and the line makes 47.55 good packs per planned minute, so EUR 0.09 of crew time a pack.
| Ledger row, one shift | kg | EUR | In OEE quality? |
|---|---|---|---|
| Log ends (trim) | 120.48 | EUR 838.54 | No |
| Giveaway, 4.3 g a pack | 92.83 | EUR 635.87 | No |
| Checkweigher rejects, 395 packs | 59.25 | EUR 471.49 | Yes |
| Leakers and crushed packs, 209 | 31.35 | EUR 249.47 | Yes |
| Start-up packs, 184 | 27.60 | EUR 219.63 | Yes |
| Set-up slices before the first pack | 13.00 | EUR 90.48 | No |
| Not placed (mass balance gap) | 11.69 | EUR 81.39 | No |
| Packs damaged after the count, 46 | 7.10 | EUR 56.28 | No |
| End-of-run purge, 2 run ends | 6.80 | EUR 47.33 | No |
| Clean-down loss | 4.90 | EUR 34.10 | No |
| Metal-detector rejects, 8 packs | 1.20 | EUR 9.55 | Yes |
| Counted by OEE quality | 119.40 | EUR 950.13 | 35% of EUR |
| Outside OEE quality | 256.80 | EUR 1,784.00 | 65% of EUR |
| Ledger total | 376.20 | EUR 2,734.13 |
Reading it. OEE quality sees 35% of the money. Log ends and giveaway, both invisible to OEE, carry 54%. At 44 shifts a month (two shifts, 22 working days) the ledger is EUR 120,301.84 a month and EUR 1,443,622.12 a year at 12 months, for one line. Food leaving as waste, giveaway aside, is 283.37 kg a shift, 7.84% of the ham in: about twice WRAP's UK manufacturing average, mostly because the log ends go to waste.
If the line is sold out, a lost pack is a lost sale, not a remake. The sample pack sells at EUR 1.86 ex works. NYU Stern margins by industry, Aswath Damodaran's January 2026 dataset, give 78 US food processing firms a gross margin of 23.23%, against a pre-tax operating margin of 10.63%. A lost pack really costs its contribution, which sits above both, because labour and overheads are paid either way, so 23.23% is a floor: EUR 1.86 x 23.23% = EUR 0.43. Swap that in for the EUR 0.09 of crew time on the 842 lost packs and the shift costs EUR 3,020.41, EUR 1,594,776.48 a year.
Five ways to cut food waste: options, costs and who picks which
Each option works on one or two ledger rows. Effort is priced at the Eurostat 2025 EU average of EUR 34.9 an hour (EUR 12.0 in Bulgaria to EUR 56.8 in Luxembourg); savings are the sample line's.
| Option | Effort or cost | Choose it if | Usual owner |
|---|---|---|---|
| 1. Changeover standard with first-pack approval | 42 hours to write and train: EUR 504.00 to EUR 2,385.60 once; saves EUR 153.96 a shift | Start-up rows are large and vary by crew | Production or CI, with QA |
| 2. Checkweigher feedback to the slicer | Controls work; EUR 236.60 a shift saved, so up to EUR 124,927.17 pays back in a year | Giveaway is a top-two row with a wide spread | QA sets the target; engineering fits it |
| 3. Log ends to a second product | 1.4 crew hours a shift (EUR 48.86); diced ham at a sample EUR 2.90 a kg nets EUR 313.78 a shift | The trim is safe food with a buyer or an in-house use | Plant manager and commercial; QA spec |
| 4. Category 3 collection, weighed by stream | Sample EUR 0.11 a kg | The stream is small or has no food outlet | QA, with the contractor |
| 5. Slicer or portioning capex | 3-year break-even: EUR 581,108.77 with ends to waste, EUR 329,795.93 after option 3 | Trim or giveaway stays large after options 1 to 3 | Plant manager and finance |
The sample assumptions: option 1 cuts set-up slices from 6.5 to 3.5 kg a set-up and start-up packs from 184 to 90; option 2 brings the checkweigher mean from 154.3 to 152.7 g; option 5 leaves ends of 0.09 kg instead of 0.16 kg, 52.71 kg less trim a shift. The order matters: once ends earn EUR 2.90 a kg as diced ham, each kilogram a new slicer saves is worth EUR 3.95, not EUR 6.96, and the 3-year break-even falls by 43%. Price capex after the cheap fixes.
With options 1 to 3, food leaving the line as waste falls from 283.37 kg to 142.79 kg a shift, 49.61% less, five times the cut the EU asks of the sector by 2030. Giveaway falls by 34.54 kg a shift too, though statistics do not count it as waste. In the business case data the return was positive at nearly every site: Champions 12.3 reviewed 1,200 business sites across 700 companies in 17 countries, food manufacturing included, and half saw a 14-fold or greater return on cutting food loss and waste (March 2017 report).
Who usually picks which. Production or CI owns option 1, because start-up scrap is a crew routine before it is a machine problem. QA owns the fill target in option 2, set by the average quantity rules and the customer spec, and the Category 3 route. The plant manager decides option 3 with the commercial team, since a second product needs a buyer, and option 5 with finance, who also choose the lens. The sustainability lead takes external figures from the ledger, not the contractor's tonnage.
Questions for your team, or for any slicer, checkweigher or line software supplier:
- What is our mass balance per line and shift, and how big is the gap nobody can place?
- What mean pack weight do we run, and how much of that margin do the average quantity rules really need?
- Can the checkweigher send its weight trend to the slicer, and who owns the setting when it drifts?
- What end weight per log will a slicer supplier commit to, measured in a trial on our logs?
- How will waste weights sit next to OEE, stops and changeovers for the same line and shift?
Putting the missing streams next to OEE
The ledger needs no new technology to start: a labelled bin per stream at each line, a floor scale and a shift sheet. Weigh before the bins go into the Category 3 container, and keep four habits:
- Same bins and names on all lines, lids coloured by stream.
- Start-up bins weighed per changeover, next to their cause.
- Giveaway from the checkweigher's shift mean, not a spot check.
- A weekly mass balance; a gap over the limit gets an owner.
A short, fixed list of scrap reason codes beats a long one operators guess at. Changeover standards and first-off approval after a changeover cut start-up scrap; startup and shutdown losses covers the shift boundaries.
The other half of the record is the line's time. With OEE software, counts and stops come from the machine signal and the operator picks the reason at the line, so the changeover behind a 6.5 kg start-up bin has a time and a cause. Joined by line and shift, the ledger stops being a monthly total. The walkthrough below shows a shift timeline, with unclassified time waiting for its reason.
What you see: a shift timeline, unclassified time waiting for a reason, and the operator's line-down screen, on sample lines. Book a demo.
Plays from YouTube. Google may set cookies when you press play. Privacy policy.
Who does what: plant manager, production and QA
Plant manager
- Put kg and EUR by stream in the weekly review, next to OEE, for each line.
- Agree one valuation lens with finance, demand met or sold out, and print it on each report.
- Hold capex requests until the ledger has four weeks of data and options 1 to 3 are priced.
Production or CI manager
- Run the bins, the scale and the shift sheet on each line.
- Write the changeover standard: settings per spec, a ceiling for set-up slices and start-up packs, and who approves the first pack.
- Take the top ledger row into the daily meeting and stay on it for four weeks before moving to the next.
QA or technical manager
- Set the fill target against each market's average quantity rules and the checkweigher's spread, and sign off any change.
- Keep metal-detector rejects as food safety records first; a waste target never changes how they are handled.
- Run the Category 3 route: segregation, labelling and records.
- Write the spec for any second product made from trim: shelf life, allergens, labelling and traceability.
Starting the ledger: the first week, then the quarter
Seven steps, in order. The first three fit in a week; the rest take a quarter.
- Bins: Put a labelled bin for each waste stream at every line, with a floor scale beside them.
- Weigh: Weigh each bin at the end of the shift and write the kg by stream next to that shift's OEE.
- Giveaway: Read the checkweigher's mean pack weight per shift and turn the excess into kg.
- Balance: After four weeks, close the mass balance: product in, packed out, streams, gap.
- Price: Price each stream with finance in one lens and rank the ledger in EUR.
- Fix: Fix the top start-up or giveaway row first; move safe trim to a second product.
- Report: Report kg of food waste per tonne packed, by line, each month.
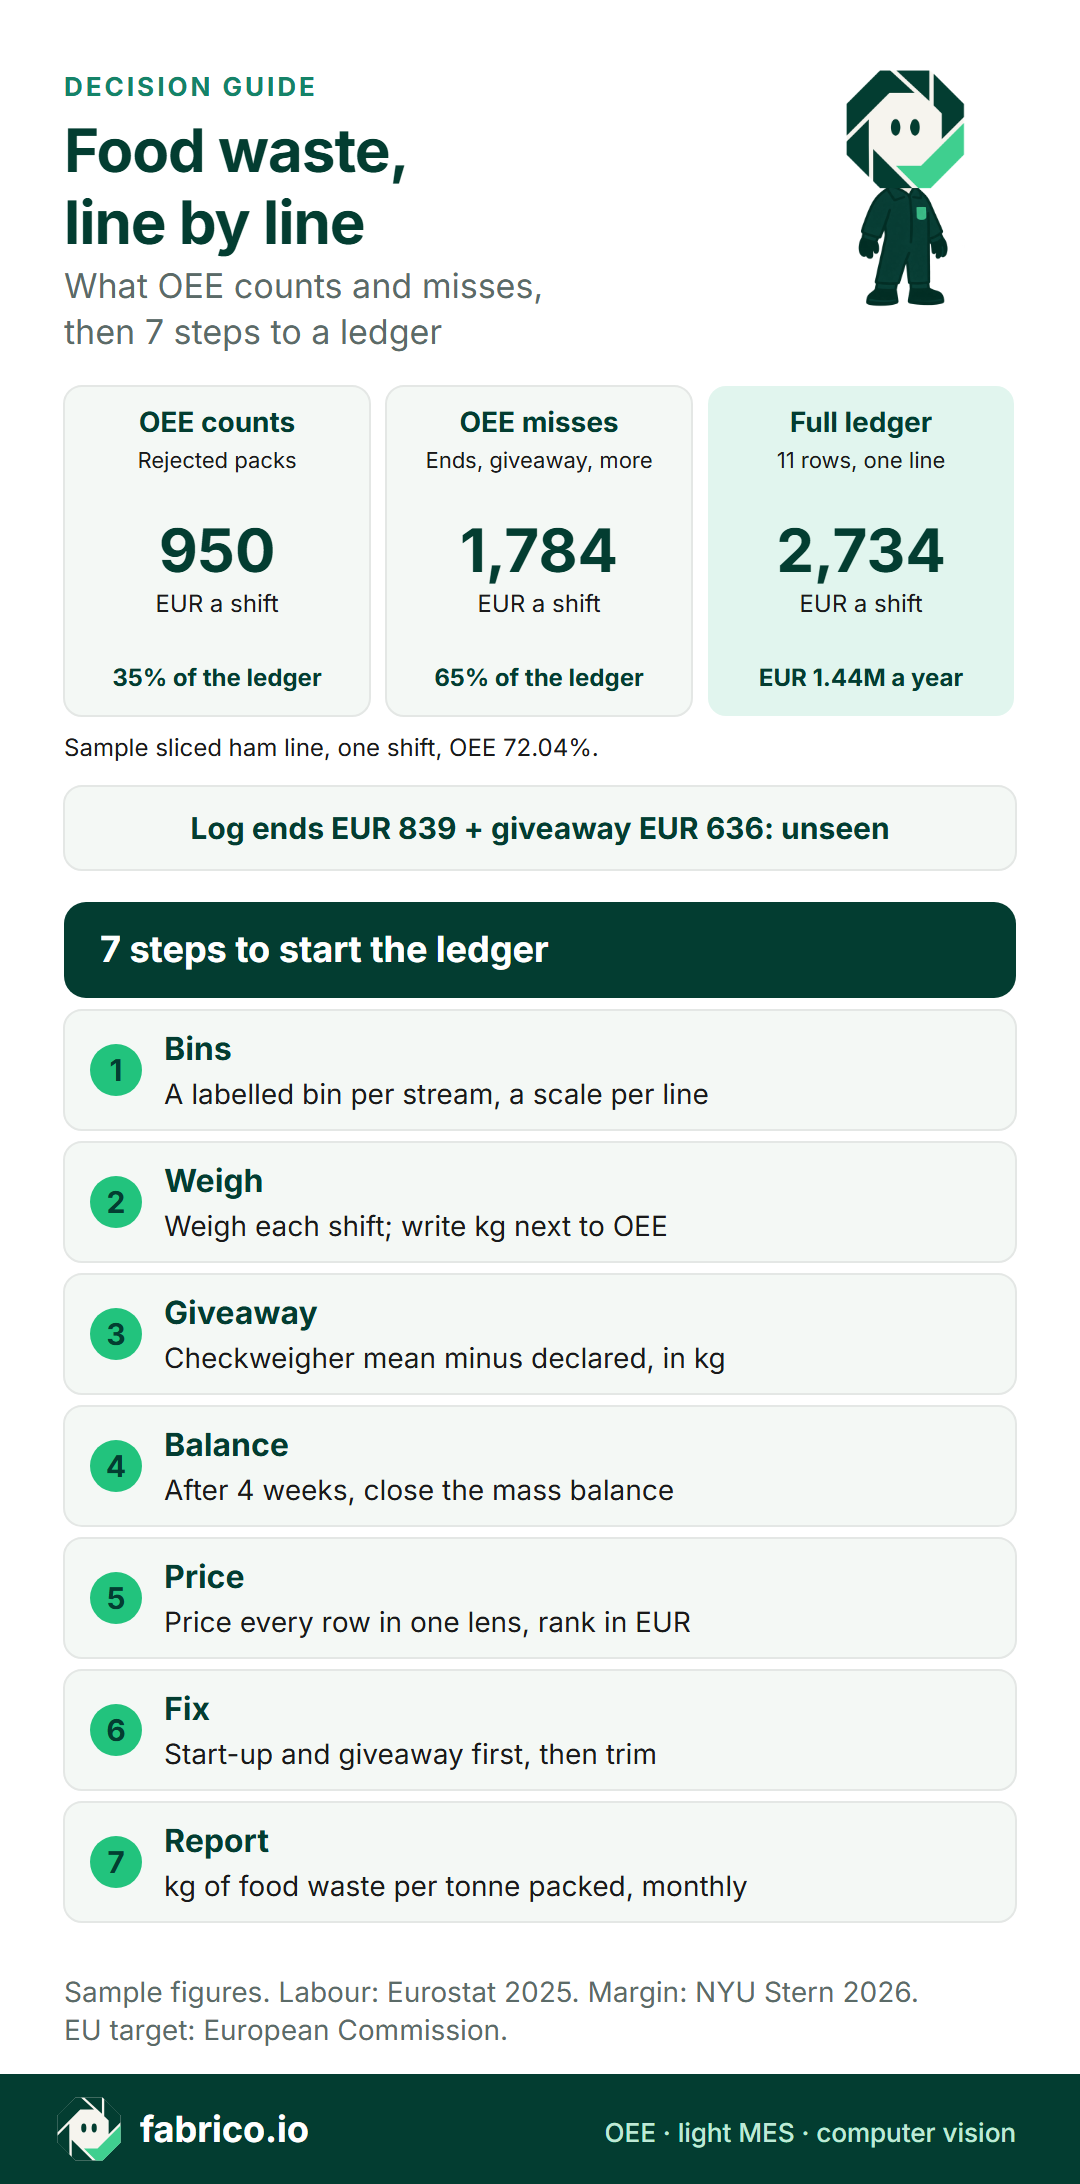
Text version of this infographic
- Sliced ham line, one shift: OEE 72.04%.
- Ledger total EUR 2,734 a shift; OEE quality sees EUR 950, 35%.
- Largest rows: log ends EUR 839 and giveaway EUR 636, both outside OEE.
- Step 1, Bins: Put a labelled bin for each waste stream at every line, with a floor scale beside them.
- Step 2, Weigh: Weigh each bin at the end of the shift and write the kg by stream next to that shift's OEE.
- Step 3, Giveaway: Read the checkweigher's mean pack weight per shift and turn the excess into kg.
- Step 4, Balance: After four weeks, close the mass balance: product in, packed out, streams, gap.
- Step 5, Price: Price each stream with finance in one lens and rank the ledger in EUR.
- Step 6, Fix: Fix the top start-up or giveaway row first; move safe trim to a second product.
- Step 7, Report: Report kg of food waste per tonne packed, by line, each month.
- Sample figures. Labour: Eurostat 2025. Margin: NYU Stern, January 2026. EU target: European Commission.
Where Fabrico fits on a food line
Fabrico is OEE and light MES software for the plant floor, with computer vision as an add-on. In the ledger, it supplies the line's time and count:
- Counts and stops come from a PLC or an IoT device with sensors, and operators choose the stop reason on a tablet or phone beside the line. The MES and OEE solution overview shows the screens.
- OEE, stops and losses per machine, line and shift, the losses priced from your own prices and margins.
- On manual stations with no usable signal, such as a hand-packing table, the camera add-on counts output, as the MES and OEE with computer vision page explains. Where the camera add-on covers the station, the video for the minute of a stop can be opened from the shift timeline, streamed on request and not stored in Fabrico.
- Excel or CSV exports, webhooks and a REST API join the shift's OEE to the waste ledger in a workbook or the ERP.
Quality inspection is not part of Fabrico, so checkweigher and metal-detector data stay with those systems. For the wider choice, food manufacturing software covers what a food plant buys first, MES for meat and poultry processing lines like this one, and MES for food manufacturing and computer vision for food manufacturing the rest of the plant.
Sources, accessed 16.11.2026: European Commission, food waste; European Commission, food waste reduction targets; WRAP, UK food waste key facts, July 2025; FAO, SDG 12.3.1 global food losses; Moores et al. 2026, Brunel University; Champions 12.3, business case 2017; US EPA, Wasted Food Scale; Regulation (EC) No 1069/2009, Article 10; NYU Stern margins by sector; Eurostat, EU hourly labour costs 2025.
Questions food plant teams ask about waste
What counts as food waste in food manufacturing?
Any food that enters the plant and leaves as something other than saleable product: start-up scrap, rejects, trim, purge, CIP or clean-down loss and damaged packs. EU statistics call it food waste; SDG reporting calls the same losses before retail food loss.
Does OEE measure food waste?
Only part of it. OEE quality counts units that were counted and then rejected. Trim, purge, clean-down loss and product made before the first pack never become units, and giveaway ships inside good packs. On the sample ham line, OEE quality saw 35% of the waste money.
How do you reduce waste in food production?
Weigh each stream by line and shift for four weeks and rank them in money. Then fix in order: changeover standards for start-up scrap, checkweigher feedback for giveaway, a second product for safe trim, capex for what is left.
How do you put a money value on food waste?
Value each kilogram at the product's cost at that step, plus packaging, collection and the line time to remake lost packs. If the line is sold out, use a lost pack's margin instead; gross margin is a floor, because contribution sits above it.
Is giveaway counted as food waste?
Not in food waste statistics, since the shopper eats it. For the plant it is a material loss: on the sample ham line, 4.3 g over 150 g on each shipped pack came to 92.83 kg a shift.
What is the EU food waste target for manufacturers?
The 2025 amendment of the Waste Framework Directive requires Member States to cut food waste in processing and manufacturing by 10% by 2030, against the 2021 to 2023 annual average. It binds Member States; check what national rules ask of a plant.
Want stops, changeovers and OEE by shift beside a waste ledger? Book a demo.
Related articles


Latest from our blog







Real Fabrico tiles, sample data.