


 Login
 Blog
Production Ramp-Up Plan for a New Line: Weekly OEE Targets

In short: a production ramp-up plan for a new line sets a measured baseline before the first saleable run, tracks weekly OEE against a target curve, names an owner for each loss, and ends on a rule agreed up front.
- Fix the rated speed, the stop reason list and the output signal before week 1.
- Draw the target curve from your own business case, not from a generic shape.
- Give each loss one owner for the warranty period: the line builder, the plant or both.
- At each review, decide one of three things: end the ramp-up, extend it with a dated plan, or escalate to the line builder.
The new line has passed its acceptance tests, the line builder's engineers are still on site and sales has promised volume. Fabrico, which we make, measures OEE, so read this page as a vendor's guide.
Related pages cover what comes before: factory and site acceptance tests, performance clauses in a new line contract and new line cost vs recovering capacity.
What a production ramp-up plan has to cover
In their 2004 paper in IEEE Transactions on Engineering Management, Terwiesch and Xu define production ramp-up as the period after a new process is introduced, with the aim of scaling output to the volumes the market asks for. Their setting is high-tech and semiconductor production, not food. A new food or FMCG line can face a similar gap: it runs, yet not at the rate, yield and stability the business case assumed.
Ramp-up has also drawn less research than launch. A 2007 Chalmers licentiate thesis on ramp-up performance, based on case studies of assembly systems at one Swedish manufacturer, found that very few studies had focused on time-to-volume, the process of ramping up to full production. A useful plan has five parts: a baseline, a weekly target curve, loss owners, checks per stage and an exit rule.
Week 0: set the baseline before the first saleable run
If the rated speed changes in week 5, or stops move to new reasons halfway through, the curve shows the change in the rules, not in the line. Settle these before the first saleable shift:
- Rated speed: the figure from the contract or acceptance protocol, per format if speeds differ.
- Planned time: whether breaks, cleaning and trials sit inside planned time. The rule stays fixed for the whole ramp-up.
- The output signal: one count at the constraint, checked against a hand count over one hour. A count off by 3% moves performance by 3%.
- Stop reasons: a short list that separates the line builder's items from the plant's, with the unclassified share tracked weekly.
- Quality: which rejects count, including start-up scrap and product run off at changeovers.
Our guide to OEE calculation covers the conventions used on this page: OEE is availability x performance x quality, losses are valued at the constraint and each lost unit is counted once.
The production ramp-up curve: actual against target
The target curve is a line you draw before week 1: where OEE should be each week, ending at the figure the business case needs. Build it from three exit limits, one per factor, and multiply them. For example, 83% availability x 85% performance x 99% quality = 69.8%, so the curve ends at about 70%.
Resist borrowing a generic curve. A 2017 simulation study of operator learning in serial and parallel flow lines, in the International Journal of Production Research, found that the line design changed the ramp-up times, and its authors point to a critical lack of empirical evidence for the learning parameters in specific operations. So set your own curve and revise it only at fixed review dates.
Which losses close first? Questions to test on your line
Treat any assumed order of losses as a question for your own data, week by week:
| Loss | Question to ask | Evidence |
|---|---|---|
| Starts and first-hour scrap | Is the time to first good pack falling each week? | Start times, scrap by hour |
| Changeovers | Is each format change closing on its standard time? | Changeover time per SKU pair |
| Machine faults | Are the same faults repeating at the same station? | Fault list by station and week |
| Minor stops | Are short stops at one infeed growing as speed rises? | Short stops by station |
| Speed loss | Is the line run below rated speed, and why? | Speed setting log |
| Rejects | Do rejects rise after each speed step? | Rejects by hour and speed |
See how minor stops differ from reduced speed. Then control changes. Terwiesch and Xu describe a copy-exactly ramp-up strategy that freezes the process for some time period, studied in semiconductor production. A food line need not freeze, but log each setting change with its time, so a dip on the curve has a traceable cause.
Who owns which loss during the warranty period
The contract decides who pays; the plan decides who acts. This table is a planning aid, not legal advice. Check each row against the contract with your legal team:
| Loss type | Starting point to check | Keep as evidence |
|---|---|---|
| Design or build faults | Line builder, per warranty terms | Stop log, fault photos, dates |
| Speed below rated | Line builder, if rated speed is in the contract | Speed log, rejects at speed |
| Changeover time | Plant, unless the time is specified | Changeover times per SKU pair |
| Packaging and materials | Plant and its suppliers | Batch, stop reason, time |
| Waiting upstream or downstream | Plant | Starved and blocked time |
| Start-up practice and training | Plant, with the builder's training | Starts by shift and crew |
If the builder brings its own monitoring, compare the figures before week 1; see OEM line monitoring vs OEE software and our guide to production monitoring systems.
A ramp-up plan template you can copy
This 12-week production ramp-up plan template uses sample targets; replace them with the curve from your own business case.
| Weeks | Focus and target | Owner | Check before moving on |
|---|---|---|---|
| 0 | Baseline: rated speed, reasons, signal, target curve | CI lead with line builder | Count matches a hand count |
| 1 to 2 | Starts and first-hour scrap; 40 to 45% | Shift leaders, builder engineers | Top 3 losses reviewed daily |
| 3 to 4 | Repeat faults by station; 50 to 54% | Line builder, plant maintenance | Each fault has an owner and a date |
| 5 to 8 | Changeover standard, speed steps; 57 to 64% | Production manager, CI lead | Rejects checked after each speed step |
| 9 to 12 | Speed loss and minor stops; 66 to 70% | Shared, per the owner table | Three weeks at or above target |
| Exit review | End, extend or escalate | Plant manager, builder's project lead | Loss log and punch list signed |
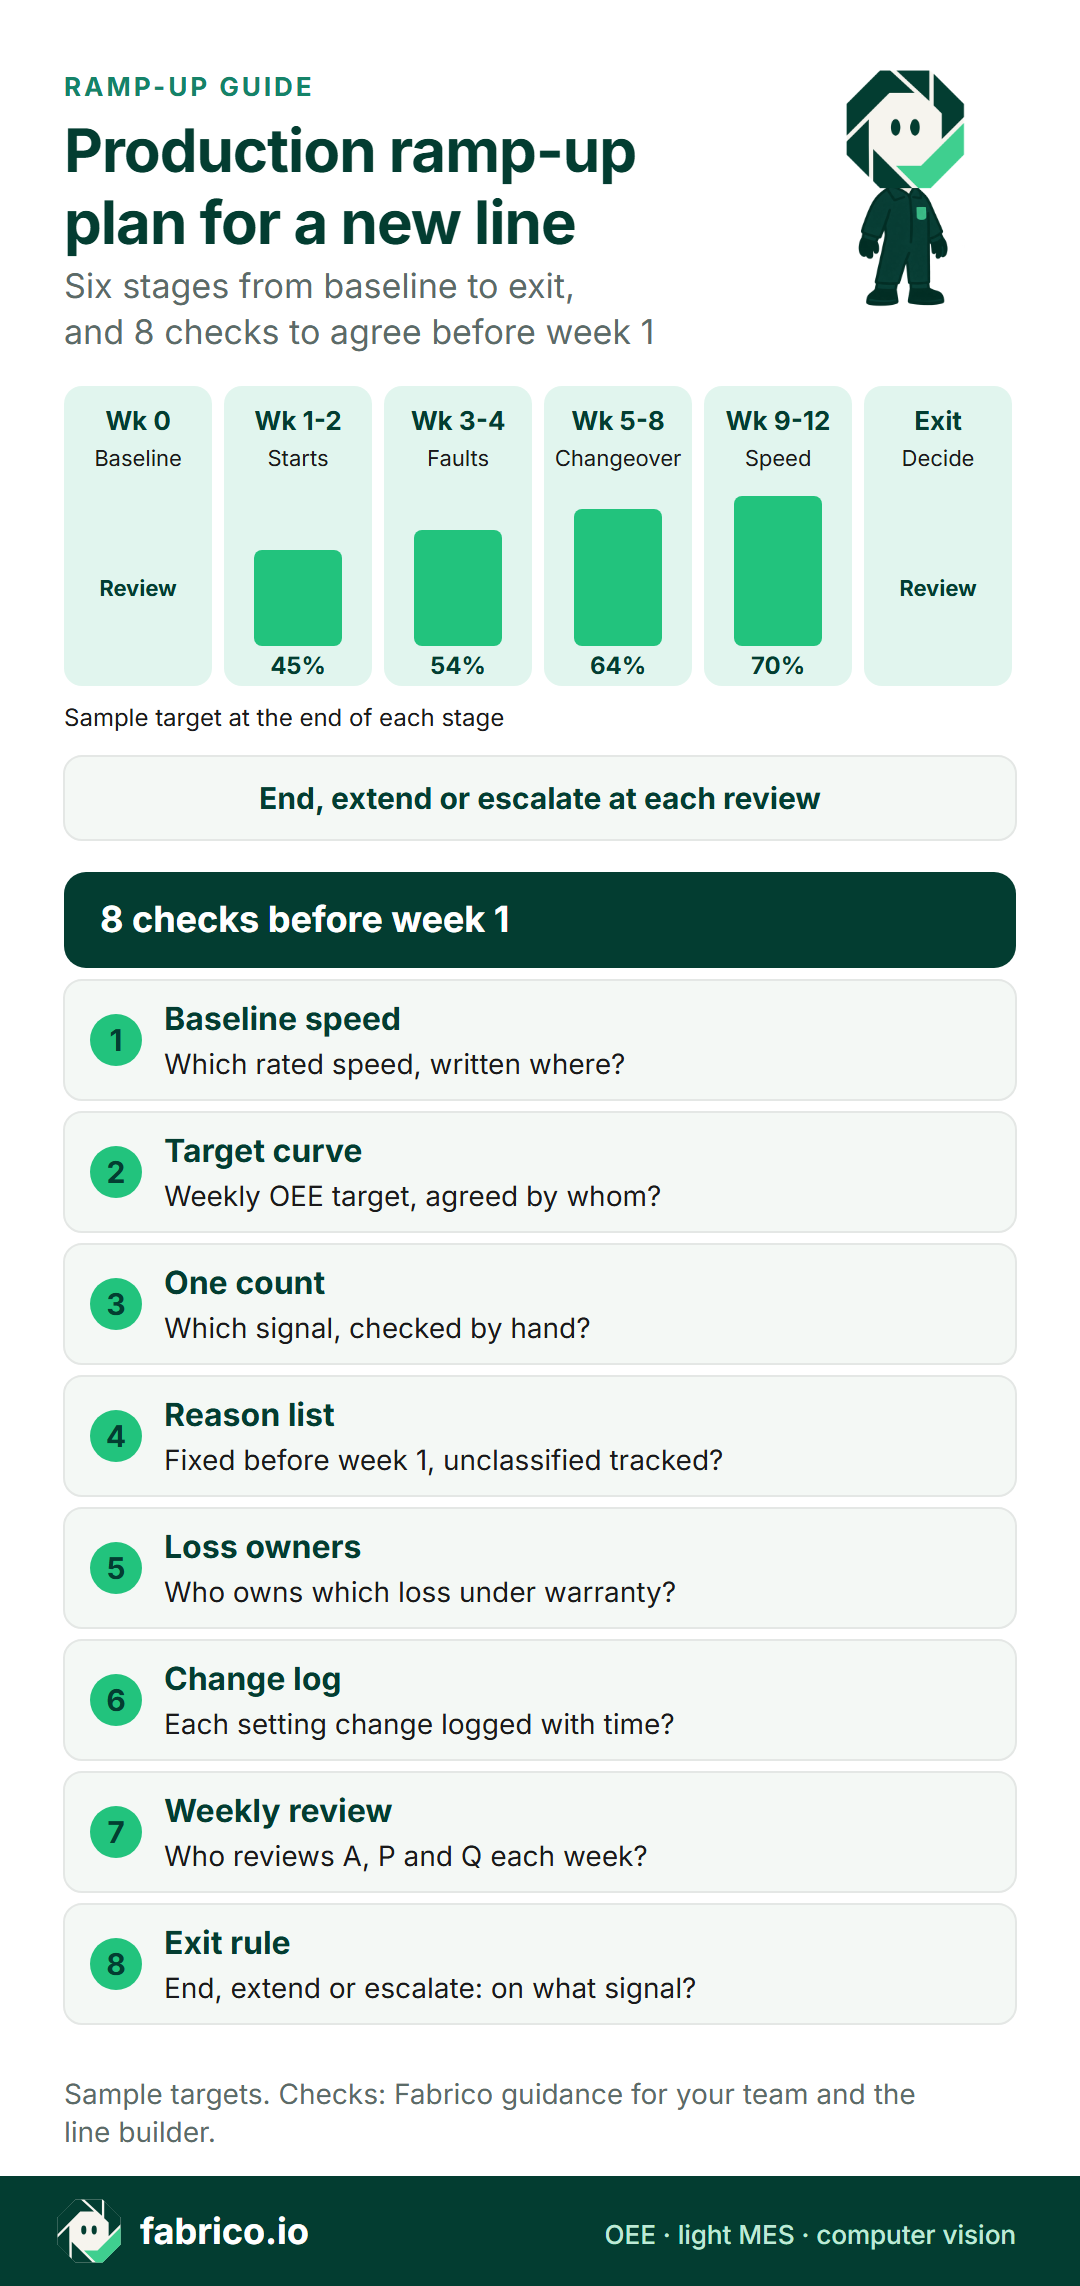
Text version of this infographic
- Card title: production ramp-up plan for a new line.
- Six week bands with sample targets: week 0 baseline, weeks 1 to 2 starts and scrap (40 to 45%), weeks 3 to 4 faults (50 to 54%), weeks 5 to 8 changeovers and speed steps (57 to 64%), weeks 9 to 12 speed and minor stops (66 to 70%), then the exit review: end, extend or escalate.
- 8 checks: baseline speed, target curve, one count, reason list, loss owners, change log, weekly review and exit rule. Each is a question in the ramp-up checklist below.
Planning a ramp-up now? Book a demo with the line builder's acceptance protocol, and we will show how its rated speed turns into a weekly target curve.
Worked example: 12 weeks on a new tray-sealing line
Sample figures for illustration only. A ready-meal plant runs a new tray-sealing line. The sealer is the constraint, rated at 120 packs a minute. Each week has 4,500 planned minutes (5 days, 2 shifts of 450 minutes), so the line could make 4500 x 120 = 540,000 packs a week.
Week 1:
- Availability: 1,710 minutes of stops, so run time is 4,500 minus 1,710 = 2,790 minutes. 2,790 / 4,500 = 62.0%.
- Performance: 212,000 packs counted against 2,790 x 120 = 334,800 possible in the run time: 212,000 / 334,800 = 63.3%.
- Quality: 15,000 rejects, so 197,000 good packs: 197,000 / 212,000 = 92.9%.
- OEE: 0.620 x 0.633 x 0.929 = 36.5%. Check: 197,000 / 540,000 = 36.5%.
Week 12:
- Availability: 760 minutes of stops, run time 3,740 minutes: 3,740 / 4,500 = 83.1%.
- Performance: 344,000 packs against 3,740 x 120 = 448,800 possible: 76.6%.
- Quality: 3,550 rejects, 340,450 good packs: 340,450 / 344,000 = 99.0%.
- OEE: 0.831 x 0.766 x 0.990 = 63.0%. Check: 340,450 / 540,000 = 63.0%.
Every week, recomputed the same way:
| Week | A x P x Q | OEE | Target |
|---|---|---|---|
| 1 | 62.0% x 63.3% x 92.9% | 36.5% | 40% |
| 2 | 66.0% x 65.7% x 94.8% | 41.1% | 45% |
| 3 | 70.0% x 67.7% x 96.1% | 45.5% | 50% |
| 4 | 73.3% x 69.7% x 97.0% | 49.6% | 54% |
| 5 | 76.0% x 71.2% x 97.6% | 52.8% | 57% |
| 6 | 78.2% x 72.4% x 98.2% | 55.6% | 60% |
| 7 | 80.0% x 73.6% x 98.5% | 58.0% | 62% |
| 8 | 81.6% x 74.7% x 98.6% | 60.1% | 64% |
| 9 | 82.2% x 75.5% x 98.8% | 61.3% | 66% |
| 10 | 82.7% x 75.9% x 98.9% | 62.1% | 67% |
| 11 | 82.9% x 76.4% x 99.0% | 62.7% | 68% |
| 12 | 83.1% x 76.6% x 99.0% | 63.0% | 70% |
Week 12 losses in packs, each counted once: stops 760 x 120 = 91,200, speed loss 448,800 minus 344,000 = 104,800, rejects 3,550. Total 199,550, and 540,000 minus 199,550 = 340,450 good packs, which matches. In week 1 stops were the biggest loss (1,710 x 120 = 205,200 packs); by week 12 it is speed loss.
In the sample, availability reached its 83% exit limit and quality was at its 99% limit after rounding, but performance moved only from 75.5% to 76.6% over weeks 9 to 12, against an 85% limit. The logs show short stops at the sealer infeed and a speed setting below rated, both in the builder's scope in this sample contract.
End the ramp-up, extend it, or escalate to the line builder
Hold a formal review at fixed points, for example after weeks 4, 8 and 12, and pick one outcome:
End the ramp-up if OEE has held at or above the target curve for three weeks, each factor is at its exit limit, the unclassified share is below the limit agreed in week 0 and the punch list is closed.
Extend it if the gap is still closing, or if it has stopped closing and the main loss sits with the plant: changeovers, starts, materials or training. Write a dated plan with a new review date.
Escalate to the line builder if the gap has stopped closing and the main loss sits in the builder's scope: rated speed, repeat design faults or minor stops at one machine. Send the loss, speed and stop logs in writing.
| Signal at the review | Outcome | Why |
|---|---|---|
| At target three weeks running | End | The curve has held, not just touched |
| Below target, gap closing | Extend | The current actions are working |
| Below target, gap flat, builder loss | Escalate | Evidence points to the builder's scope |
| Below target, gap flat, plant loss | Extend with a new plan | Change the action, not the target |
| High unclassified stop share | Extend | The record is too thin to decide |
Ramp-up checklist: questions for your team and the line builder
Agree these eight points before week 1:
- Baseline speed: Which rated speed is the baseline, and in which document is it written?
- Target curve: What OEE target applies in each week, and who agreed it?
- One count: Which signal counts output, and was it checked against a hand count?
- Reason list: Is the stop reason list fixed before week 1, with the unclassified share tracked?
- Loss owners: Who owns each loss type during the warranty period?
- Change log: Is each setting change logged with its time, so its effect shows on the curve?
- Weekly review: Who reviews availability, performance and quality each week, and what goes to the line builder?
- Exit rule: What ends the ramp-up, what extends it, and what triggers an escalation?
Where Fabrico helps during a ramp-up
Fabrico gives the plant and the line builder one shared record of the new line.
- The weekly curve from machine data: OEE is calculated from data collected at the machine, from a PLC or IoT device with sensors, not from figures typed in after the shift.
- When a drop began: OEE tracking shows each machine over the current shift or a past period, and the dashboard updates while the line runs.
- Causes for the owner table: operators tag stop reasons on a tablet or phone, and a technician can open a work order from the stop, on the same machine record.
- The gap to target: losses are shown in money, and the OEE calculator prices the gap between current OEE and the target.
- Hand-pack steps after the line: with no machine signal there, the camera add-on counts output; in the standard setup camera add-on video is streamed on request and not stored in Fabrico. Stop-reason suggestions are on the camera add-on roadmap.
Weekly figures can go to the line builder through the REST API, webhooks or a CSV file. More on the solution overview, OEE software, light MES, the camera add-on for OEE and the FMCG camera add-on hub.
Questions teams ask during a ramp-up
What is a production ramp-up plan?
It is the week-by-week plan for a new or rebuilt line, from the first saleable run until the line holds its target output. It sets the baseline, a weekly OEE target curve, an owner for each loss, the checks for each stage and the rule that ends the ramp-up.
How long should a production ramp-up take?
Set it from the contract, the business case and the line builder's commissioning plan, as a date with a review. The 12 weeks in the sample show the method; they are not a benchmark.
What is a production ramp-up curve?
It is weekly OEE plotted from the first saleable week, next to a target curve that ends at the business case figure. The gap between the two lines, split into availability, performance and quality, tells you which loss to work on next.
Which losses close first on a new line?
It depends on the line, so measure it rather than assume it. Split each week's OEE into availability, performance and quality, then check whether starts, changeovers and faults close faster than speed loss and minor stops on your line.
Who owns losses during the warranty period?
The contract decides, so check it with your legal team. In the plan, give each loss type one named owner: the line builder, the plant or both. Keep the stop log, the setting changes and the weekly review notes, so any claim rests on the same record.
When is the ramp-up done?
When the line meets an exit rule agreed before week 1. For example: OEE at or above the target curve for three weeks in a row, each factor at its exit limit, and a closed punch list. If the gap stops closing, extend or escalate instead.
Want the weekly curve in place before the first saleable shift? Book a demo with the target figures from the business case for the new line.
Related articles









Real Fabrico tiles, sample data.