


 Login
 Blog
Manufacturing Variance Analysis: Tie Each Variance to a Line Loss

In short: manufacturing variance analysis splits the gap between standard and actual cost into price and quantity variances. The price side belongs to buyers and HR; the quantity side (labour efficiency, material usage, overhead volume) usually starts on the line, which is where OEE explains it.
- On a fixed-crew line, labour efficiency variance is crew cost x (1 minus actual OEE / standard OEE).
- Lost output appears three times: labour efficiency, overhead volume and lost sales. Count it once.
- A favourable price variance can hide an unfavourable usage variance on the same material.
- In the worked example the variance report shows EUR 63,639 unfavourable for the month; the cash and margin actually lost is EUR 33,298.
Every month the plant controller sends a variance report and every month production reads it as a verdict. Labour efficiency is red, material usage is red, overhead is under-absorbed, and the meeting turns into an argument about whose number it is.
This guide is for the plant controller and the plant or production manager who want the report to lead to actions. It sets out the seven variances and their formulas, shows which ones a line loss explains and which it cannot, runs one frozen pizza line through a month in variances and in OEE with the money carried through, and compares four ways to connect the two.
The seven manufacturing variances and their formulas
A standard cost says what one unit should cost: so many hours at a standard rate, so many grams at a standard price, and a share of overhead. Variance analysis compares that with what the month actually cost for the output it actually made. As the OpenStax managerial accounting text puts it for labour, the time variance compares the actual hours used with the standard hours expected for the units produced, and the rate variance compares the actual rate per hour with the standard rate for the hours worked.
| Variance | Formula | Usual cause on the floor | Explained by OEE? |
|---|---|---|---|
| Labour rate | (actual rate minus standard rate) x actual hours | Overtime premium, agency mix, pay settlement | No |
| Labour efficiency | (actual hours minus standard hours for actual output) x standard rate | Stops, slow running and rejects on a fixed crew | Yes: A, P and Q |
| Material price | (actual price minus standard price) x actual quantity | Commodity prices, supplier terms | No |
| Material usage or yield | (actual quantity minus standard quantity for actual output) x standard price | Rejects (in OEE), giveaway, purge and trim (outside OEE) | Partly |
| Variable overhead efficiency | (actual hours minus standard hours) x standard variable overhead rate | Same causes as labour efficiency when overhead follows hours | Yes |
| Fixed overhead spending | actual fixed overhead minus budgeted fixed overhead | Contracts, energy tariffs, maintenance spend | No |
| Fixed overhead volume | (budgeted volume minus actual volume) x fixed overhead rate | Lost output (OEE) or missing orders (demand) | Partly |
Standard costing is far from a relic. A Management Accounting Quarterly paper from 2010 cites studies in which 76% of 303 accountants in the UK and 73% of 85 finance and accounting specialists in New Zealand used it, and a Malaysian study in which 70% of 66 local firms and 76% of 21 Japanese firms did. If your plant runs SAP, Oracle or a similar ERP, the variance report already exists. What is usually missing is the link from each line of it to a cause on the floor. Two related pages cover the costing side: standard cost vs actual cost and OEE cost per unit.
Which variances the line explains, and which it cannot
Read the table above by its last column. Three groups fall out:
- Price, rate and spending variances are not line losses. A buyer paying less for cheese, a pay settlement or a new energy tariff changes them, and no amount of OEE work will.
- Efficiency and volume variances come from output. If the crew and the fixed costs stay the same and the line makes fewer good units, the hours and the overhead per unit go up. That is availability, performance and quality, the three parts of OEE.
- Usage variances are split. Rejected units are an OEE quality loss. Overfill on good units, product purged at start-up and trim are not, because OEE counts a heavy but saleable unit as good.
World Class Manufacturing formalised this link long ago. A 2020 case study in Management and Production Engineering Review describes Cost Deployment as a way to set up a cost reduction programme in a scientific and systematic way, run as a collaboration of production people and financial control. Its steps include separating causal losses from resultant losses and translating the identified wastes and losses into costs. You do not need the full pillar system to use the idea: put the loss data and the variance report on the same page every month.
The loss data has to exist first, by line and by cause. OEE software that reads the machine signal records run and stop time and counts, and operators give the cause of long stops on a tablet or phone at the line, so the month's availability, performance and quality per line are ready at month-end instead of being rebuilt from shift sheets. The walkthrough below shows the line screen and how unclassified stop time waits for a reason.
What you see: a shift timeline, unclassified time waiting for a reason, and the operator's line-down screen, on sample lines. Book a demo.
Plays from YouTube. Google may set cookies when you press play. Privacy policy.
Worked example: a frozen pizza line's month in variances and in OEE
Sample figures for illustration only. A German plant runs one frozen pizza line, 400 g pizzas, at an ideal rate of 60 a minute. It runs two shifts of 450 planned minutes for 21 days: 18,900 planned minutes and an ideal output of 1,134,000 pizzas. The crew is 14 people paid 8 hours a shift. The standard cost was built on 70.0% OEE, a standard labour rate of EUR 49.50 an hour (the Destatis figure for manufacturing in Germany, labour cost per hour worked in 2025), 110 g of cheese per pizza at EUR 5.20 a kg, and a budget of 780,000 good pizzas, which customers had ordered.
The month on the line:
- Stops took 3,402 minutes, so 15,498 minutes of run time: availability 82.0%.
- The line made 734,605 pizzas against 929,880 at the ideal rate in that run time: performance 79.0%.
- 29,384 were rejected at the end of the line, leaving 705,221 good: quality 96.0%.
- OEE = 82.0% x 79.0% x 96.0% = 62.19%, against 70.0% in the standard.
- The cheese depositor drifted to an average of 116 g a pizza, and 1,380 kg of cheese was purged at start-ups and changeovers. The buyer paid EUR 4.75 a kg instead of EUR 5.20.
| Variance | Calculation | Result | Line cause |
|---|---|---|---|
| Labour efficiency | (4,704 h minus 4,179.1 h) x EUR 49.50 | EUR 25,983 U | Availability, performance, quality |
| Fixed overhead volume | (780,000 minus 705,221) x EUR 0.3974 | EUR 29,720 U | Lost output (orders were there) |
| Cheese usage | (86,594.2 kg minus 77,574.3 kg) x EUR 5.20 | EUR 46,903 U | Rejects in OEE; giveaway and purge outside |
| Cheese price | (EUR 4.75 minus EUR 5.20) x 86,594.2 kg | EUR 38,967 F | Purchasing |
| Total on the report | EUR 63,639 U |
The labour rate variance is zero here, because the crew was paid the standard rate. The standard hours come from the standard itself: 14 x 8 hours make 18,900 pizzas a shift at 70.0% OEE, so 705,221 good pizzas earn 4,179.1 standard crew hours. The crew worked 4,704.
Two checks make the link to OEE visible. First, on a fixed-crew line the labour efficiency variance is the month's crew cost, EUR 232,848, times 1 minus 62.19% / 70.0%: EUR 25,983, the same figure. Second, the overhead volume variance is the 74,779 pizzas the line did not make times the EUR 0.3974 of fixed overhead each was meant to carry (EUR 310,000 over 780,000 pizzas). Both come from the OEE gap: labour efficiency prices all 7.81 points (88,579 pizzas), overhead volume the 74,779 pizzas short of budget.
Three variances, one cause: count the OEE gap once
Lost output is the single biggest story in this month, and it appears three times. The labour efficiency variance prices it as crew hours, the overhead volume variance prices it as under-absorbed fixed cost, and the sales line prices it as pizzas the customer ordered and did not get. At a sample price of EUR 1.46 a pizza and the NYU Stern gross margin of 23.23% for food processing (78 US firms, January 2026), each missing pizza gave up about EUR 0.34 of margin: EUR 25,362 for the 74,779 pizzas. Gross margin is a floor, because contribution sits above it.
Add the three and the month looks like EUR 81,065 lost to the OEE gap. It was not. The crew was paid and the fixed costs were spent whatever the line made; neither variance is extra cash. They are the same lost output, allocated twice. The cash and margin view is:
- Margin on the pizzas not made, because the line could not make them: EUR 25,362.
- Cheese wasted, at standard price: EUR 46,903.
- Less the cheaper cheese: EUR 38,967.
- Net: EUR 33,298 for the month, against EUR 63,639 on the variance report.
If the plant had made the shortfall up on Saturday shifts instead, the margin would have been kept and the cost would have moved into overtime and the labour rate variance. Either way, the OEE gap gets one price, not three. Over twelve months like this one, that gap is worth about EUR 304,343 in margin alone.
When a favourable price variance hides a usage problem
Net, the cheese lines on the report show only EUR 7,936 unfavourable, the kind of number nobody asks about. Underneath, the plant used 9,019.9 kg more cheese than the standard allows for the good pizzas it made, worth EUR 46,903, and a cheaper buying price paid most of it back. Prices like that move: Eurostat's agricultural price release shows the EU average price of milk 16.6% lower in the second quarter of 2026 than a year earlier. When the price turns, the usage problem is still there and the windfall is not.
The OpenStax chapter on how companies use variance analysis makes the same point from the other side: asking managers to explain favourable variances lets them judge whether a favourable variance is sustainable. Split the usage variance by cause and the picture is clear:
- Giveaway, the extra 6 g on every good pizza: 4,231.3 kg, EUR 22,003. OEE does not see it; the pizza is good.
- Cheese on rejected pizzas: 3,408.5 kg, EUR 17,724. This is the OEE quality loss, priced in material.
- Start-up and changeover purge: 1,380 kg, EUR 7,176. Outside OEE too.
Why do lines drift heavy? Because the legal floor punishes light packs and nothing punishes heavy ones. Under the UK's Weights and Measures (Packaged Goods) Regulations 2006 (SI 2006/659), Schedule 3, an example of the legal floor (check the rules in each market you sell into), the tolerable negative error for a pack of 300 to 500 g is 3%, 12 g on a 400 g pizza, and packers set targets above nominal to stay clear of it. The 6 g of cheese here is 1.5% of the pack weight on one ingredient alone. Giveaway and overfill as an OEE quality loss covers how to measure it at the checkweigher.
Connecting variances to line data: four set-ups, effort and who picks which
The question is not whether to do variance analysis; the ERP already does it. It is how much line data sits next to it each month. Effort below is controller, engineer and supervisor hours a month, priced with the Destatis manufacturing labour cost per hour worked in 2025: from EUR 10.20 in Bulgaria to EUR 55.00 in Denmark, and EUR 49.50 in Germany. Those are averages for all manufacturing employees, so treat them as floors for finance and engineering time. Software and setup costs are not included; ask vendors.
| Set-up | Effort a month | Choose it if | Watch out for |
|---|---|---|---|
| Month-end report only | 6 to 10 hours: EUR 61 to 550; about EUR 396 in Germany | Lines run close to standard and variances are small and stable | Arguments about causes; usage problems hidden by price |
| Month-end plus weekly line bridge from shift sheets | 22 to 36 hours: EUR 224 to 1,980; about EUR 1,436 in Germany | You need the link now and have a supervisor with time | Shift sheets miss short stops and slow running; hours creep up |
| Machine-signal OEE with losses in money, bridge each month | 8 to 14 hours: EUR 82 to 770; about EUR 545 in Germany | Several lines, fixed crews, and quantity variances that move month to month | Stop reasons must be entered at the line, or the bridge has gaps |
| Re-base the standards on demonstrated OEE | 40 to 60 hours: EUR 408 to 3,300; about EUR 2,475 in Germany | The standard OEE is a target nobody has reached, so every month is red | Re-basing hides the gap unless the target stays visible next to it |
Re-basing is a one-off effort of the size shown, repeated each budget round; the other three recur monthly. In the example, the month's quantity variances (EUR 102,606 on the report) dwarf even the top of any effort range, so the cheapest set-up is rarely the cheapest choice. A plant with one stable line is the exception.
Who should pick which. The plant controller and the plant manager decide together, because the bridge only works if both sign it. Choose the month-end report alone if variances are small. Choose the weekly bridge from shift sheets as a stopgap. Choose machine-signal OEE when quantity variances are large, recur and span several lines. Re-base the standards when they have become fiction, but keep the old target in view so the gap does not vanish.
Questions to settle before you start:
- To the ERP team: which OEE, hours per unit and grams per unit are built into the current standard, and when were they last set?
- To finance: is the fixed overhead volume variance split between lost output and missing orders today?
- To production: are stop reasons entered on every shift, and what share of stop time has none?
- To quality: where is giveaway measured, and is the target weight written down per product?
- To an OEE software vendor: how do losses get priced in money, and how does that data reach finance at month-end?
- To both: who owns each line of the bridge, by name, before the next month-end?
Who does what at month-end: controller, plant manager, production manager
Plant controller. Builds the variance report and splits it: price, rate and spending to their owners, quantity variances to the bridge. Splits the overhead volume variance into lost output and missing orders, and values the OEE gap once. Keeps a record of when each standard was set, so a variance can be traced to a stale standard rather than a bad month.
Plant manager. Chairs a 30-minute bridge review with the controller and the production manager in the first week of the month. Decides which two quantity variances get an action and an owner, and checks last month's actions first. Refuses any discussion of a variance that has not been routed through the questions in the flow above.
Production manager, with quality. Brings the month's OEE by line with availability, performance and quality, and the top causes in each. Brings giveaway, purge and trim in kilograms, which OEE does not show. Owns the actions on the line and reports whether they held, in the same units next month.
For the money side of OEE, OEE and cost per unit shows how losses change unit cost, and how to set OEE targets covers where the OEE in the standard should come from in the first place.
The month-end variance bridge in seven steps
- Split: Separate price, rate and spending variances from quantity variances.
- OEE: Put the month's OEE next to the OEE built into the standard, by line.
- Labour: On fixed-crew lines, check that labour efficiency equals crew cost x (1 minus actual OEE / standard OEE).
- Material: Split usage into rejects, giveaway, start-up purge and trim, in kg and euros.
- Volume: Split the overhead volume variance into lost output and missing orders.
- Count once: Value the OEE gap once, as lost contribution or as extra shifts, never as three variances added up.
- Owner: Give each line on the bridge one owner and one action before the next month-end.
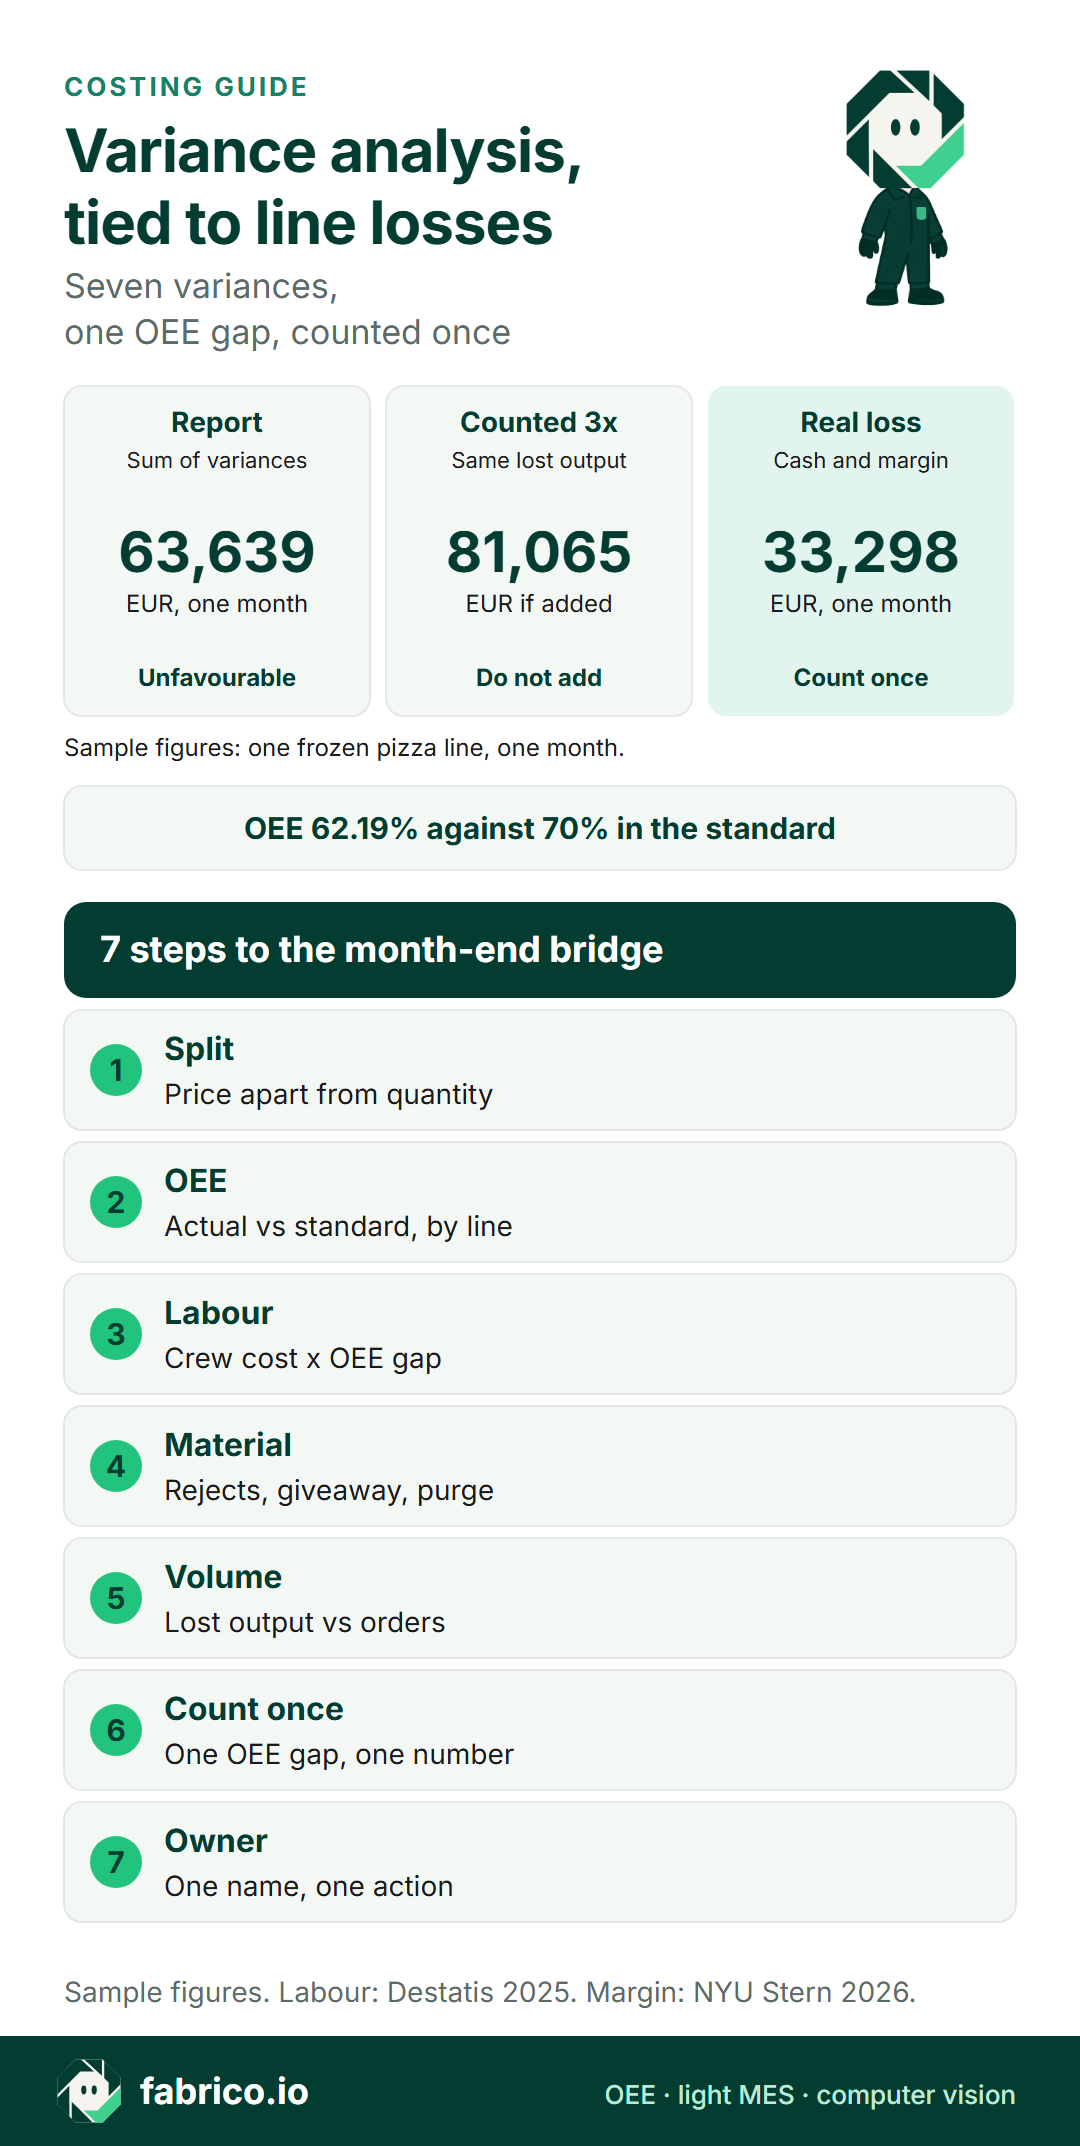
Text version of this infographic
- Variance report for the month: EUR 63,639 unfavourable.
- Cash and margin actually lost: EUR 33,298.
- OEE 62.19% against 70.0% in the standard.
- Step 1, Split: Price apart from quantity.
- Step 2, OEE: Actual vs standard, by line.
- Step 3, Labour: Crew cost x OEE gap.
- Step 4, Material: Rejects, giveaway, purge.
- Step 5, Volume: Lost output vs orders.
- Step 6, Count once: One OEE gap, one number.
- Step 7, Owner: One name, one action.
- Sample figures. Labour: Destatis 2025. Margin: NYU Stern, January 2026.
Where Fabrico fits in variance analysis
Fabrico is light MES and OEE software for the plant floor. It does not replace the ERP's cost accounting; it supplies the quantity side of the bridge:
- Run time, stop time and counts come from a PLC or an IoT device with sensors, and operators give long stops a cause from a short grouped list on a tablet or phone, so the month's losses per line are split by cause. The OEE and light MES solution page shows the screens.
- OEE and its losses by machine, line and shift, priced from the prices and margins you enter, so the OEE gap arrives at month-end in euros rather than percentage points.
- On manual end-of-line stations with no usable signal, the camera add-on counts output; see MES and OEE with computer vision and computer vision for food manufacturing. Where the camera add-on covers the station, the video for the minute of a stop can be opened from the shift timeline, streamed on request and not stored in Fabrico.
- The loss data can go to the controller's workbook or the ERP side by Excel or CSV export, webhooks or the REST API.
Quality inspection is not part of Fabrico, so giveaway at the checkweigher stays with your weighing system. For food plants, MES for food manufacturing compares the wider options.
Sources, accessed 16.11.2026: OpenStax, labour variances; OpenStax, how companies use variance analysis; Management Accounting Quarterly 2010; Mróz 2020, Management and Production Engineering Review; Eurostat, agricultural prices Q2 2026; UK Weights and Measures (Packaged Goods) Regulations 2006 (SI 2006/659), Schedule 3; NYU Stern margins by sector; Destatis, EU labour cost per hour worked.
Questions controllers and plant managers ask about variances
What is manufacturing variance analysis?
It compares the actual cost of what a plant made with the standard cost of the same output, and splits the difference into variances: labour rate and efficiency, material price and usage, and overhead spending, efficiency and volume. Each variance says how much of the gap came from paying a different price and how much from using a different quantity.
What are the main manufacturing variances?
Seven do most of the work: labour rate, labour efficiency, material price, material usage (or yield), variable overhead efficiency, fixed overhead spending and fixed overhead volume. Price, rate and spending variances belong to purchasing, HR and contracts. Efficiency, usage and volume variances usually start on the production line.
How do you calculate labour efficiency variance?
Labour efficiency variance = (actual hours worked minus standard hours allowed for the actual output) x standard rate per hour. Using more hours than the standard allows for what was made is unfavourable. On a line with a fixed crew, it works out to the crew cost times one minus actual OEE divided by the OEE built into the standard.
How is OEE related to manufacturing variances?
OEE explains the quantity side. Availability, performance and quality losses show up as labour and overhead efficiency variances on fixed-crew lines and as a volume variance when output falls short of budget; quality losses also show up in material usage. Price, rate and spending variances and overfill on good units sit outside OEE.
Why can variance reports overstate or hide losses?
They overstate when one cause, lost output, appears as labour efficiency, overhead volume and lost sales at once and someone adds the three. They hide when a favourable price variance nets off an unfavourable usage variance on the same material, so a waste problem disappears in the total.
Who should own variance analysis in a plant?
The plant controller builds and explains the report, the plant manager owns the actions, and production and quality managers own the quantity variances on their lines. The analysis works best as a monthly bridge both finance and production sign, rather than a finance report that production reads afterwards.
Want to see a month of line losses priced in euros, ready for the variance bridge? Book a demo.
Related articles





Latest from our blog





Real Fabrico tiles, sample data.