


 Login
 Blog
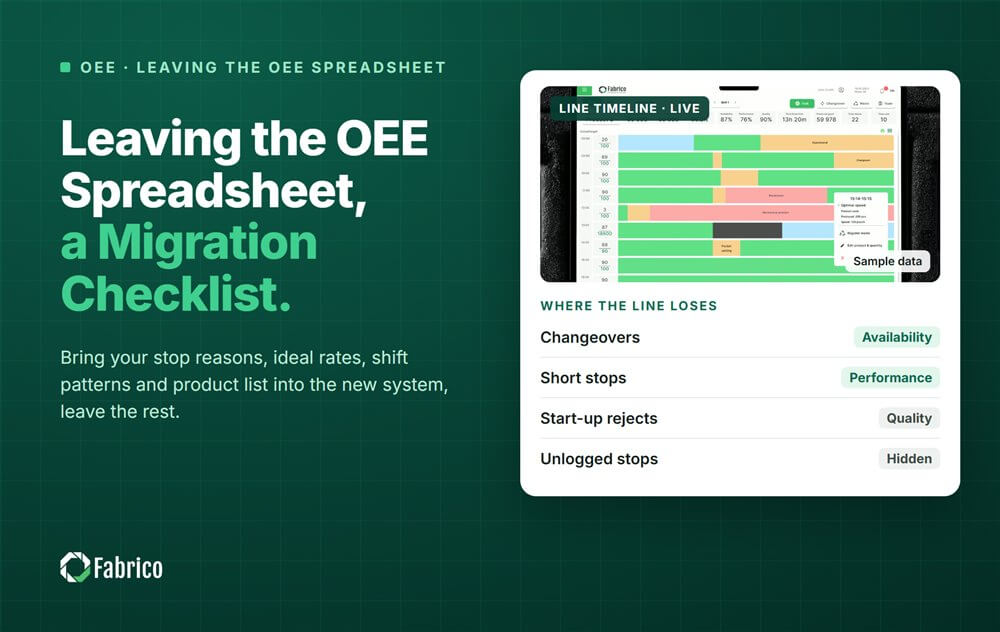
Leaving the OEE Spreadsheet: a Migration Checklist

Key takeaways
- To leave an OEE spreadsheet, bring over four things: the stop reason list, ideal rates, shift patterns and the product list.
- Leave behind old formulas, hand-typed totals and reason codes nobody uses.
- Run spreadsheet and machine OEE side by side on the same shifts before you switch the sheet off.
- Expect the machine number to be lower at first: it counts the short stops the sheet missed.
- Freeze the definitions before you compare, or the gap means nothing.
To leave an OEE spreadsheet, bring over four things: your stop reason list, ideal rates per product, shift patterns and the product list. Leave the old formulas and unused codes behind. Then run both on the same shifts, compare spreadsheet OEE with machine OEE, and explain the gap before you switch the sheet off.
The spreadsheet says line 2 had a good night. The machine data for the same shift shows 31 short stops on the capper that nobody wrote down.
This guide is for CI (continuous improvement) leads and line managers moving from a spreadsheet to OEE software. It comes from Fabrico, a vendor of OEE and light MES software with computer vision on stops. The checklist works with any system.
What should you bring over from the OEE spreadsheet?
Four lists that took years of plant knowledge to build. Clean each one before it goes in.
- The stop reason list. Merge duplicates, drop codes nobody has used, and keep the operators' own words. See operator friendly reason codes.
- Ideal rates per product, the fastest the line can make each one. Check each against the nameplate. Our guide to ideal cycle time helps you choose.
- Shift patterns and planned stops: shift times, breaks, cleans and what counts as planned.
- The product list, with pack sizes and the line each product runs on.
What should you leave behind?
Anything that only made sense inside the spreadsheet. Keep the old file read-only, as a reference.
- Formulas nobody can explain any more.
- Totals typed in by hand at the end of the shift.
- Catch-all codes such as "other" and "misc".
- One tab per person, with different rules on each.
- Colour codes that only one person understands.
If you are still deciding whether to move at all, our comparison of Excel and OEE software lays out the trade-offs.
How do you compare spreadsheet OEE with machine OEE?
Run both on the same shifts, with the same definitions, and explain the gap factor by factor.
- Freeze the definitions: ideal rates, planned stops, the minor stop cutoff and the good count.
- Keep filling the spreadsheet as before, on the same shifts the machine data covers.
- Compare OEE shift by shift, then split the gap into Availability, Performance and Quality.
- Name the reason for each gap: short stops, slow running, rejects or a definition error.
Check the math on both sides with our OEE calculation guide.
Why does OEE usually drop after you leave the spreadsheet?
Because the machine sees what people never wrote down. The number is not worse; it is closer to the truth.
- Short stops cleared in under a minute rarely reach a paper log.
- Slow running looks like running, so it never gets a line in the sheet.
- Rounding: a 7 minute stop gets written as 5.
- Memory: stops are filled in at the end of the shift.
Our article on why your OEE number is wrong goes deeper.
When can you switch the spreadsheet off?
When every gap between the two numbers has a named reason, and the line uses the new screen.
- The definitions are frozen and signed.
- Operators confirm stop reasons on the line screen.
- The shift meeting uses the new numbers, not the sheet.
- The old file is read-only, and everyone knows where it is.
A worked example: one week of spreadsheet OEE vs machine OEE
Sample line (illustrative numbers, not a customer): line 2 of a juice plant, one filler and one capper, 2 shifts of 450 planned minutes each. Both columns use the same frozen definitions. OEE is the daily average of both shifts.
| Day | Spreadsheet OEE | Machine OEE | Gap (points) | Main reason |
|---|---|---|---|---|
| Monday | 74% | 63% | 11 | Short stops on the capper |
| Tuesday | 71% | 64% | 7 | Short stops on the capper |
| Wednesday | 76% | 62% | 14 | Slow running after a changeover |
| Thursday | 70% | 66% | 4 | Rounded stop times |
| Friday | 73% | 65% | 8 | Short stops on the capper |
- Spreadsheet average: (74 + 71 + 76 + 70 + 73) / 5 = 364 / 5 = 72.8%.
- Machine average: (63 + 64 + 62 + 66 + 65) / 5 = 320 / 5 = 64.0%.
- Gap: 72.8 minus 64.0 = 8.8 points.
- Monday morning shift: the sheet logged 25 minutes of stops, the machine logged 61.
- Availability on the sheet: (450 minus 25) / 450 = 94.4%. From the machine: (450 minus 61) / 450 = 86.4%.
- The 36 extra minutes were 48 short stops of 45 seconds: 48 x 0.75 = 36 minutes.
The machine number is lower, and that is the point. Most of the gap is short stops on the capper, which the sheet never saw. The plant fixed the capper's cap chute first, then switched the sheet off once each day's gap had a named reason.
Mistakes plants make with spreadsheet migration
- Copying every old reason code, including "other".
- Changing definitions while the two numbers are being compared.
- Switching the sheet off before the gap is explained.
- Treating the lower number as a software error.
- Running both systems with no end, so nobody trusts either.
Where Fabrico fits
Fabrico is a computer vision enabled Manufacturing Performance Platform. OEE and light MES come first, so the move off the spreadsheet starts with stops and their reasons.
- Automatic downtime logging: the short stops the sheet missed are logged from the machine.
- The operator confirms the reason in one tap, from the cleaned reason list you brought over.
- OEE live by line and shift, so the comparison runs shift by shift.
- Losses ranked by money, so the first fix goes to the loss worth the most.
You start on one line, with a baseline and a decision date agreed in advance. Devices are connected in about one month, and the full rollout takes 3 to 4 months. There is no free plan and there are no tiers: each plant gets a quote.
See how stops are captured on the computer vision OEE page.
Frequently asked questions
Why is OEE lower after leaving Excel?
Because the machine logs what people never wrote down: short stops, slow running and the minutes lost to rounding. The spreadsheet number was too high, not the new one too low. Explain the gap factor by factor, and it becomes your first list of losses to fix.
Should we import our old spreadsheet data?
Import the lists, not the history. Bring over the stop reasons, ideal rates, shift patterns and products. Keep the old results in a read-only file for reference, because they were counted with different rules and will not compare cleanly with machine data.
How long should we run the spreadsheet and the new system side by side?
Until each gap between the two numbers has a named reason and the line uses the new screen. Set that as the rule, not a calendar date. Then switch the sheet off, so nobody keeps two versions of the truth.
What should we do with our old stop reason codes?
Clean them before they go in. Merge duplicates, drop codes nobody used, and replace catch-alls like "other" with the real reasons behind them. Keep the operators' own words, and test the new list at the line before go-live. A short list in plain words gets used.
Can we keep the spreadsheet for reports?
Only as a read-only archive. If people keep typing into it, you will have two OEE numbers and endless arguments about which one is right. Build the reports you need from the machine data instead. Keep one source of truth, and make it the machine data.
Bring your spreadsheet to a demo
Bring one shift of your spreadsheet and the line it covers. We will show the same shift from machine data and where the gap comes from.
Latest from our blog


Real Fabrico tiles, sample data.