


 Login
 Blog
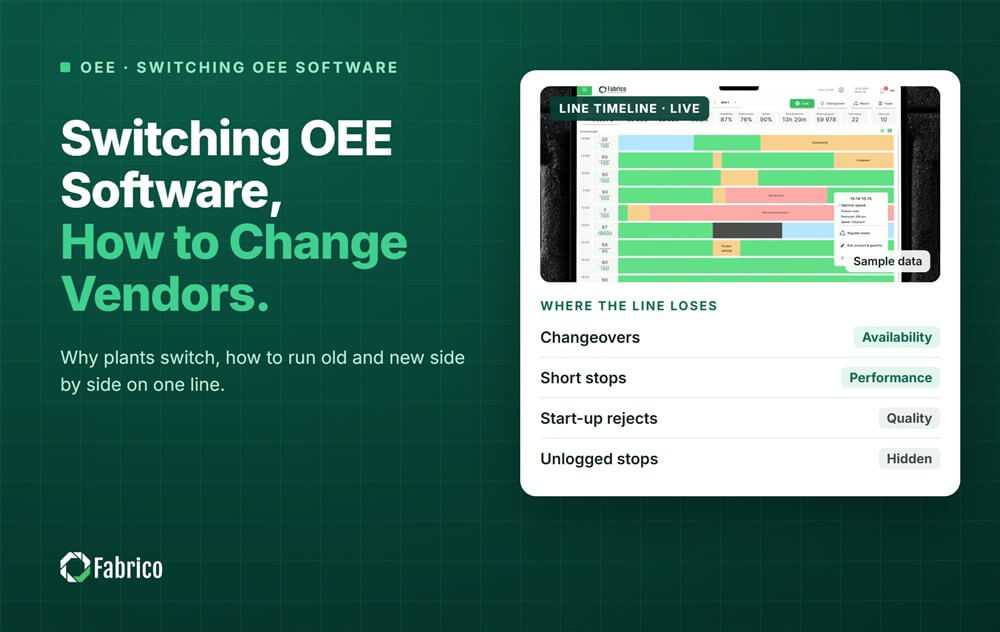
Switching OEE Software: How to Change Vendors

Key takeaways
- To switch OEE software, map the old stop reasons and definitions, then run old and new side by side on one line.
- Plants usually switch because operators stopped using the old tool, the numbers were not trusted, or it could not reach older machines.
- Map each old stop reason to a new one before go-live, so history stays comparable.
- Keep the baseline comparable: same definitions, same ideal cycle times, same shifts.
- Tell the operators early, and show them what changes on their screen.
The short answer: switch OEE software one line at a time. Export your history first, and map the old stop reasons and OEE definitions to the new tool. Then run both side by side on the same shifts. Turn the old one off only when the numbers agree, or when you can explain why they differ.
On line 3, operators still tap the old tablet out of habit. The new screen shows a lower OEE for the same shift. Nobody changed the line: the two tools simply count short stops differently.
This guide is for plant managers and continuous improvement leads changing their OEE (overall equipment effectiveness) software. It comes from Fabrico, a vendor of OEE and light MES software with computer vision on stops. The steps work whichever tool you move to.
Why do plants switch OEE software?
Most plants switch because the old tool stopped being used, not because it broke. Common reasons:
- Operators stopped entering stop reasons because it took too long.
- The OEE number was not trusted, so nobody acted on it.
- Older machines with no PLC (programmable logic controller) were never connected.
- Losses were shown in minutes only, never in money.
- A group needs one view across plants, and each site runs a different tool.
Check first that the problem is the tool and not the definitions. A new tool with the same bad ideal cycle times gives the same bad number. Our article on why OEE numbers go wrong helps you tell the two apart.
How do you run old and new side by side on one line?
Pick one line and run both tools on the same shifts, so you can compare like with like.
- Export the old history before anything changes.
- Connect the new tool to the same machines, with the same planned time.
- Keep operators entering reasons in one tool only, usually the new one, to avoid double work.
- Compare the two OEE numbers shift by shift, and explain each gap.
- Turn the old tool off on that line once the gaps are explained, then move to the next line.
How do you map stop reasons and OEE definitions?
Write a mapping table from each old reason to one new reason, before go-live. Then fix the definitions in the same meeting.
- Merge reasons that mean the same thing, and split "other" where it hides a real cause.
- Keep the new list short. Long lists push operators back to "other".
- Copy the ideal cycle time per product, and the rules for planned stops, from the old tool.
- Agree the short stop threshold, since tools differ on it, and write it down.
Our guide to downtime reason code design shows how to build the new list.
How do you keep the baseline comparable?
Use the same definitions in both tools, or rebuild the old baseline with the new ones. Otherwise the switch looks like a change on the line.
- Compare the same shifts, products and planned time.
- Expect the new tool to find more short stops if it reads the machine signal, so OEE may drop at first.
- Note each definition change with its date, so later readers know where the line in the chart moved.
Our guide to downtime definitions that keep OEE honest has a template you can copy.
How do you tell the operators about the switch?
Tell them before the new screen appears, and explain what changes for them.
- Show the new screen at the line, on their own machines.
- Show how a stop reason is confirmed, and how long it takes.
- Explain that OEE is shown by line and shift, never by named person.
- Ask which old reasons confused them, and fix the list with them.
Operators who help build the new stop list are the ones who use it. Our guide to OEE implementation covers the people side of a rollout.
Sample: mapping old stop reasons to new ones
Sample line (illustrative numbers, not a customer): a bottling line moves from an old tool with 24 stop reasons to a new one with 12. Both run on the same 5 shifts of 480 planned minutes.
| Old reason | Old minutes (5 shifts) | New reason | Note |
|---|---|---|---|
| Filler jam, filler fault | 95 | Filler jam | Two old reasons merged |
| Capper stop | 60 | Capper jam | Renamed |
| Labeller glue, labeller paper | 70 | Labeller material | Two old reasons merged |
| Changeover | 85 | Changeover | Same |
| Other | 50 | Split by the clip review | Hid short stops at the capper |
| Not logged (under 2 minutes) | 0 | Short stops | New tool counts them |
- Planned time: 5 x 480 = 2,400 minutes.
- Old tool stops: 95 + 60 + 70 + 85 + 50 = 360 minutes, so availability = (2,400 minus 360) / 2,400 = 2,040 / 2,400 = 85.0%.
- New tool adds 96 minutes of short stops: 360 + 96 = 456 minutes.
- New availability = (2,400 minus 456) / 2,400 = 1,944 / 2,400 = 81.0%.
- Gap: 85.0 minus 81.0 = 4.0 points, all from short stops the old tool never logged.
The line did not get worse. The new tool sees more. The plant writes the 4-point gap into the baseline note, and judges the new tool against 81.0%, not against the old 85.0%.
Mistakes plants make when switching OEE software
- Switching off the old tool before exporting its history.
- Changing definitions and tools at the same time, with no note.
- Asking operators to enter reasons in both tools.
- Reading the lower OEE as a worse line.
- Moving every line at once instead of one line first.
Where Fabrico fits
Fabrico is a computer vision enabled Manufacturing Performance Platform. OEE and light MES come first, so the switch starts from your stops and your definitions.
- Automatic downtime logging: stops, short stops included, come from the machine signal through a PLC, a Fabrico IoT device or an AI camera.
- The operator confirms the reason in one tap, so the new stop list gets used.
- A camera clip as evidence for a stop, which helps split the old "other" into real causes.
- OEE live by line and shift, so old and new can be compared shift by shift.
Devices are connected in about one month, and the full rollout takes 3 to 4 months. You start on one line, with a baseline and a decision date agreed in advance. There is no free plan and there are no tiers: each plant gets a quote. See the camera side on our computer vision OEE page.
Frequently asked questions
How long does it take to switch OEE software?
It depends on the number of lines and how each machine connects. Plan it line by line: export, map, run side by side, then switch off. For Fabrico, devices are connected in about one month, and the full rollout takes 3 to 4 months. Ask any vendor for the same two figures.
Can we keep our old OEE history?
Yes, if you export it before the old contract ends. Ask for stop events, counts, OEE by line and shift, the stop reason list and the ideal cycle times, in plain files. Keep the old definitions with the data, so the history can be compared with the new numbers.
Why is OEE lower in the new software?
Usually because the new tool sees more. Tools that read the machine signal count short stops that a manual log or an older tool missed. Check that both tools use the same planned time and ideal cycle times. If they do, the gap is a better view of the line, not a worse line.
Should we run both systems at the same time?
Yes, on one line, for a set number of shifts agreed in advance. Run both tools on the same machines and compare OEE shift by shift. Keep operators entering reasons in only one tool, so they do not do the work twice and the data stays clean.
How do we tell operators about the switch?
Early, at the line, on their own machines. Show how a stop reason is confirmed, and explain that OEE is shown by line and shift, never by person. Ask which old reasons confused them. Operators who help build the new list are the ones who use it.
Plan your switch on one line
Bring your old stop reason list and one week of exports. We will show how they map and what the new numbers would look like.
Latest from our blog


Real Fabrico tiles, sample data.