Login
 Blog
Filler OEE on a Bottling Line: Measuring the Machine That Sets the Pace

Key takeaways
- The filler is the pace setter: a minute lost at the filler is a minute of line output gone for good.
- Split filler time into running, starved, blocked and down, and charge starved and blocked minutes to the machine that caused them.
- Set the rated speed per bottle format, not from a good shift's average.
- Give CIP and changeovers a standard time; only the minutes over it are an Availability loss.
- Read line OEE at the filler, then use station data to explain the lost minutes.
At 02:40 the filler on line 2 stops for the fourth time in an hour. Nothing is wrong with it: the outfeed table is full because the labeller missed a reel splice. The shift report later shows filler OEE well below target, and the morning meeting spends ten minutes on filler valves that never failed.
The filler is the most expensive machine on a bottling line and the one that sets its speed. That makes it the best place to read line OEE and the easiest place to misread it. This guide covers the filler's states, how to measure each OEE factor at the filler, CIP and changeovers, and fill level rejects.
Why the filler sets the speed, and why line OEE is read there
Bottling lines are built around one critical machine, almost always the filler. The classic design rule is the V-curve: the machines next to the filler run about 10% faster in recovery speed, and each machine further out another 10% faster (LineView on the V-curve). Accumulation tables on both sides keep the filler fed when the depalletiser or rinser stops, and let it keep running when the labeller or case packer stops.
Little's law gives the protection time: a table holding 1,500 bottles in front of a filler running 500 a minute is 3 minutes of protection (Little's law).
The consequence is simple. A minute lost at the filler cannot be made up, because nothing runs the filler above its rated speed. A minute lost at the palletiser is often recovered, because the palletiser has spare speed. So the cleanest line OEE is read at the filler: good bottles at the end of the line against the filler's rated speed over planned production time. Averaging every machine's OEE means little, because a labeller built to run faster than the filler always shows lower Performance against its own rated speed.

Where the filler's time goes
| State | On the floor | OEE factor | Whose loss |
|---|---|---|---|
| Running slow | Speed set below rated, or slowing as infeed accumulation runs low | Performance | Filler, or upstream |
| Starved | Filler ready, infeed empty | Availability | The upstream machine that stopped first |
| Blocked | Filler ready, outfeed table full | Availability | The downstream machine that stopped first |
| Down, own fault | Burst bottle, fallen bottle at a starwheel, valve or capper fault, no caps | Availability | Filler |
| CIP and product change | Rinse, flush or full clean between products | Availability, minutes over standard | Filler crew and process team |
| Format change | Change parts and settings for a new bottle size | Availability, minutes over standard | Filler crew |
| Short stops | Stops cleared in a minute or two | Performance or Availability, by threshold | Filler or a neighbour |
Starved and blocked are not the filler's fault, yet they cost the line as much as a filler breakdown. PackML, the packaging machine state model, keeps them apart: Held is an internal machine condition, Suspended is external, such as starved or blocked.
How to measure Availability, Performance and Quality at the filler
- Availability = run time / planned production time. Starved, blocked, breakdowns and changeover overruns all reduce run time.
- Performance = bottles filled / (run time x rated speed). Slow running and short stops below the plant's threshold land here.
- Quality = good bottles / bottles filled. Fill level rejects, burst bottles, missing or crooked caps and low fills after a restart count against it.
Set the rated speed per bottle format and product, from the nameplate or the maximum demonstrated speed for that format, and hold it under change control. A 0.5 litre and a 1.5 litre bottle do not fill at the same speed, and a carbonated product may need a slower setting than still water. If Performance ever reads above one, the ideal is wrong. Our guide to ideal cycle time for OEE covers how to set and govern it.
Starved, blocked and down: three different problems
Down means the filler failed. Starved means it was ready but no bottles arrived. Blocked means it had nowhere to put them. A down state comes with a PLC fault code; starved and blocked come from photo eyes on the tables, an infeed low level sensor and an outfeed back-up sensor.
Log which machine stopped first and charge the starved or blocked minutes to that root-cause machine, not to the filler that was waiting. Then report filler OEE twice: with all losses, which is what the line delivered, and with starved and blocked time charged elsewhere, which is how well the filler itself ran. Our guide to starvation and blocking on packaging lines walks through the method.
CIP, product changeover and format changeover
A product change, such as one flavour to another, needs a rinse or flush and sometimes a full CIP. A format change needs change parts: infeed screw, starwheels, guide rails, capper heads and new fill height settings. Measure each one from the last good bottle of the old run to the first good bottle of the new run at rated speed, ramp-up included.
Set a standard time per changeover type. The standard can sit in planned time; each minute over it is an Availability loss with a reason code. Do not shorten a validated CIP or allergen clean to win OEE points: that is a food safety decision. The gains are in the steps around the clean: change parts staged before the line stops, settings recorded per format, and a start-up routine that gets fill levels right on the first bottles.
Fill level rejects and the filler's quality losses
A fill level inspector after the capper rejects underfilled bottles, and on many lines also missing or crooked caps. Each reject is a full bottle of product and packaging lost, the most expensive loss per unit.
Look at when rejects happen. Low fills cluster after restarts, after product changes and when product temperature drifts, because foaming changes the fill height on carbonated products. Overfill is the opposite problem: OEE counts the bottle as good, but the extra product is given away. Price it next to OEE, as in our guide to giveaway and overfill as a quality loss.
Data sources: what each one sees at the filler
| Source | Tells you | Misses |
|---|---|---|
| PLC state and fault codes | Running, stopped, fault number, speed | Why a starwheel jammed |
| Table sensors | Starved, blocked, buffer levels | Which machine further away caused it |
| Counters and inspector | Count in and out, fill level and cap rejects | The stop between two bottles |
| Camera on infeed or outfeed | Fallen bottles, a full table, the clip before a stop | The inside of the filler bowl and valves |
| Operator input | The reason, confirmed in one tap | Short stops nobody has time to log |
The PLC is the clock: it sets the start and length of the stop. Where a camera watches the station, it adds the clip and a suggested reason, and the operator confirms it. That matters most for short stops the PLC records only as stopped, such as a fallen bottle at the infeed starwheel.
A worked shift at the filler
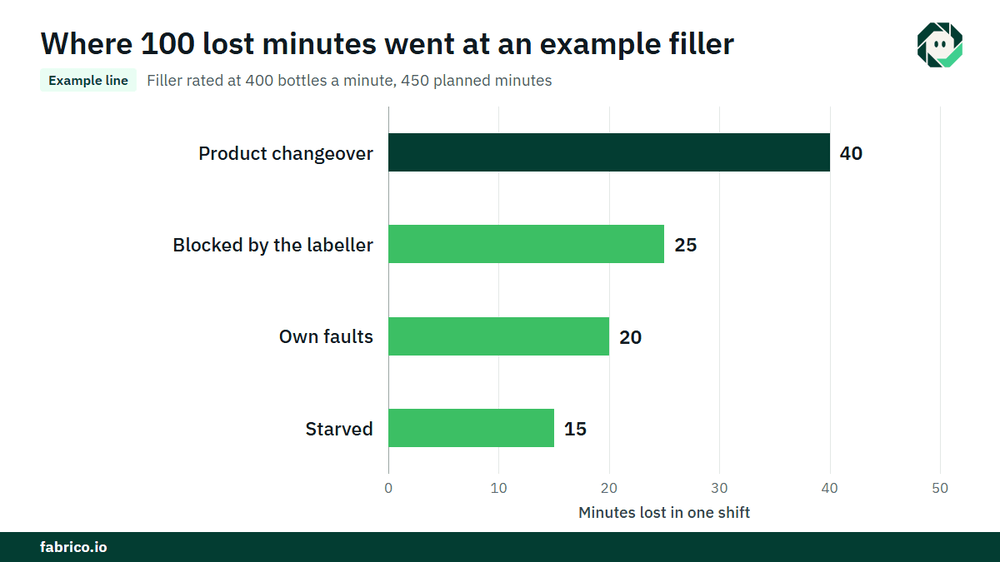
Sample line (illustrative numbers, not a customer): a filler rated at 24,000 bottles an hour, which is 400 a minute, on a 480 minute shift.
- Planned production time: 480 minus a 30 minute break where the line stops = 450 minutes.
- Lost time: 40 minutes of product changeover, 20 of own faults, 15 starved and 25 blocked by the labeller = 100 minutes. Run time = 350 minutes.
- Availability = 350 / 450 = 77.8%.
- At rated speed, 350 minutes would fill 350 x 400 = 140,000 bottles. The filler filled 126,000. Performance = 126,000 / 140,000 = 90.0%.
- Fill level and cap rejects: 1,260. Good bottles = 124,740. Quality = 124,740 / 126,000 = 99.0%.
- OEE = 0.778 x 0.900 x 0.990 = 69.3%. Check: 124,740 / 400 = 311.85 minutes of ideal time, and 311.85 / 450 = 69.3%.
Now price the 25 blocked minutes. At 400 a minute they are 10,000 bottles the line never made. At a contribution of $0.10 a bottle that is $1,000 a shift, or €1,000 in a euro plant at €0.10 a bottle. Over 750 shifts a year it is $750,000, or €750,000. On the filler's report those minutes look like a filler problem; charged to the labeller, they become its most expensive loss.
Mistakes plants make with filler OEE
- Charging starved and blocked minutes to the filler.
- Using one rated speed for every format.
- Logging only stops over five or ten minutes, so short stops vanish into Performance.
- Moving changeovers into planned time with no standard.
- Counting bottles as good before the fill level inspector has rejected anything.
- Setting the V-curve speeds once and never checking them as formats change.
Where Fabrico fits
Fabrico is a computer vision enabled Manufacturing Performance Platform. OEE and light MES come first: automatic downtime logging at the filler and its neighbours, and OEE live by line and shift, so the filler's number and the line's number come from the same data.
- Stops logged automatically, including starved and blocked time, from the machine signal.
- The operator confirms the reason in one tap at the line.
- A camera clip as evidence for a stop, where a camera watches the infeed or outfeed.
- Losses priced in money and ranked, so blocked minutes and changeover overruns show up in dollars or euros, largest first.
- One view across plants for bottling lines on different sites.
- A work order with its cost to the right technician when a stop is a breakdown.
You start on one line, with a baseline and a decision date agreed in advance. Each plant gets a quote after a review of its lines. See how stops get their evidence on our computer vision for OEE page.
Frequently asked questions
How do you calculate OEE for a filler?
Multiply Availability, Performance and Quality: run time over planned production time, bottles filled over what the filler could fill at rated speed in that run time, and good bottles over bottles filled. Use the rated speed of the format that ran.
Should starved and blocked time count against filler OEE?
Count it, because the line lost that output, but charge it to the machine that caused it. Show filler OEE with and without it so the cause is clear.
What is a good OEE for a bottling line?
There is no single target. The often quoted 85% is usually traced to Seiichi Nakajima's Introduction to TPM (1988). Compare your filler with its own baseline, by format.
Does CIP count as planned downtime in OEE?
A scheduled CIP at its standard length is usually treated as planned. Minutes over the standard, and an unplanned clean after a problem, are Availability losses. Write the rule down and apply it on each line.
What causes low fill levels on a filler?
Product temperature and foaming on carbonated products, restarts after a stop and wrong settings after a changeover. Track rejects by time and by event to see whether they follow restarts or drift over the shift.
See your filler's losses in a demo
Bring one bottling line and its current downtime log. We will show its stops and its starved and blocked minutes, logged automatically and priced in money.
Latest from our blog