Login
 Blog
How to Track Downtime on Food and Beverage Lines

In short: To track downtime on a food or beverage line, let the machine record when it stops, and let the operator say why in one tap.
- Use a short reason list built around cleaning, CIP, changeovers, jams and waiting.
- Code planned stops apart from unplanned ones, and write down how each counts in OEE.
- Catch micro-stops from the machine signal, because nobody writes them down.
- Review the data every shift, or operators stop trusting it.
Most plants already "track" downtime. A clipboard hangs on the filler, or a spreadsheet gets filled in at the end of the shift.
The effort is there. But paper misses the short stops and loses the reasons.
This guide is about capturing downtime on filling, packing and processing lines so the numbers are complete and operators actually use the system.
It is not about fixing causes. For that, read how to reduce downtime in food and beverage manufacturing.
Why food and beverage lines are hard to track
Food and beverage lines have losses that discrete plants see less often.
- Cleaning and CIP take scheduled time every day.
- Changeovers happen between flavours, recipes, formats and labels.
- Product is wet, sticky or fragile, so jams are frequent and short.
- Lines are linked: when the capper stops, the filler soon stops too.
- Washdown makes tablets and paperwork awkward on the floor.
If you record all of this as one "stop" bucket, you learn nothing. If you use 60 codes, nobody picks the right one.
Good tracking sits between the two.
Step 1: Decide what counts as downtime
Write one rule and put it on the wall. For example: downtime is any time the line is scheduled to run and is not running.
Running slowly is not downtime, it is a performance loss. Scrap and rework are quality losses. Track both, but not on this list.
Then decide how to treat the three tricky groups.
Planned stops
Scheduled CIP and planned cleaning are planned stops. Code them, so they are visible but do not look like failures.
A clean nobody scheduled, such as after a spill or a failed swab, is unplanned. Code a CIP that runs past its standard length as an overrun.
Whether planned cleaning lowers OEE depends on your plant's own definition. Some plants take it out of planned production time. Others count it as an availability loss.
Both can work. Pick one, write it down and use it on every line, or the lines cannot be compared.
Changeovers
Give changeovers their own category. Flavour, format and label changes each have a different target time, so keep them apart.
Planned does not mean free. The usual OEE view counts changeover time as an availability loss, because the line is scheduled and not making product.
Some plants take changeovers out anyway. That is their definition to make, but it lifts the number without saving a minute. The worked example below shows by how much.
Starved and blocked time
Starved means a machine has nothing coming in from upstream. Blocked means it cannot pass product on downstream.
If the filler stops because the labeller downstream is down, record the minutes on the filler as blocked and name the labeller as the cause. Otherwise the filler gets blamed for stops it did not cause.
For line OEE, count stops at one point, usually the constraint machine, so the same stop is not counted twice.
Step 2: Build a short reason list
Aim for 8 to 15 first-level reasons. Operators should find theirs in two seconds.
| Group | Example reasons | Type |
|---|---|---|
| Cleaning | Scheduled CIP, washdown, sanitation check | Planned |
| Changeover | Flavour or recipe, format parts, label | Changeover |
| Jams and handling | Bottle or can jam, carton jam, label fault | Unplanned |
| Waiting | Materials, packaging, people, quality release | Unplanned |
| Equipment fault | Machine alarm, sensor, seal or valve | Unplanned |
| Inspection and coding | Metal detector, checkweigher, date coder | Unplanned |
| Process | Temperature, mix, hold time, cooling | Unplanned |
Keep a free-text note for the odd case, but do not let it become the most used reason.
Allergen and hygiene stops
Give allergen changeovers and hygiene holds their own reason. They have a fixed procedure and should never be cut short to improve a number.
Seeing them separately also lets you plan the schedule around them.
Step 3: Let the machine record the stop
The machine knows when it stopped, how long it stayed down and how often. People are bad at all three.
Pick the capture method per machine, not per plant.
| Machine | How to capture |
|---|---|
| Modern filler, seamer, packer | Read cycles and stops from the PLC |
| Older or semi-automatic machine | Add an IoT device with an external sensor |
| Manual or mixed step | Use a camera to count output and detect cycles |
| No signal available | Operator enters start, stop and counts on a tablet |
A mixed plant is normal. All sources can feed one OEE calculation.
Micro-stops
A jam that clears in 20 seconds will never reach a clipboard. Ten of them an hour is over 25 minutes in an 8 hour shift.
Only machine data catches these. They usually count as a performance loss, not availability, and your own rule sets the length that separates the two. See micro-stops for how to define and count them.
Step 4: Let the operator add the reason
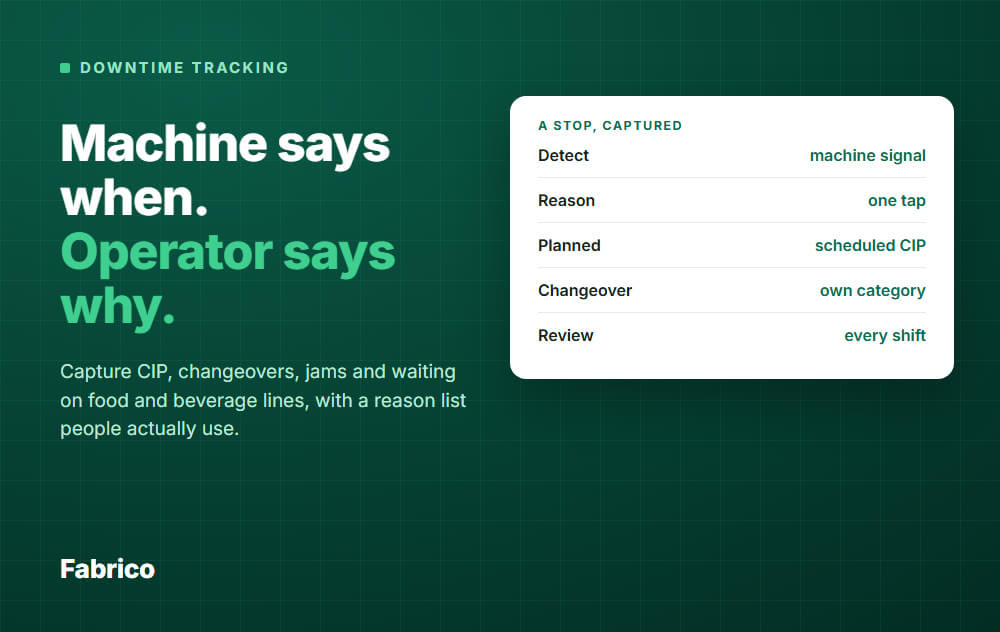
The machine says when. The operator says why. Make that second step almost free.
- One screen, large buttons, the six to ten top reasons first.
- The reason is asked when the stop happens, not at the end of the shift.
- A tablet or phone near the line, in a washdown-safe mount where needed.
- Gloves on: no typing, no scrolling through a long list.
Short stops can be grouped. Ask for a reason once the stop passes a set length, such as two minutes, and let the shorter ones be counted as micro-stops.
Step 5: Make it a shift routine
Data that nobody reviews soon stops being entered. Build three habits.
Start of shift
Check that the line, product and target speed are set correctly. A wrong rated speed makes OEE look odd from the first hour.
During the shift
The supervisor looks at the live line status. Any stop without a reason gets a quick nudge.
End of shift
Spend five minutes on the top three reasons. Clear the unclassified time. This is also where the team agrees what to try next.
Over a few weeks, rank the reasons with a Pareto of downtime. The ranking shows where the minutes really go.
Worked example: what the data tells you
Example numbers, not from any real plant. A filling line is scheduled for 480 minutes and logs 160 minutes of stops.
- Changeover: 45 minutes
- Planned CIP: 40 minutes
- Jams and micro-stops: 30 minutes (20 in stops under two minutes, 10 in longer jams)
- Waiting for materials: 25 minutes
- Unclassified: 20 minutes
Here, 20 minutes of the 160 have no reason. That is one stop minute in eight that nobody can explain.
So the first target is unclassified time, not jams. Bring it near zero and the other four numbers can be trusted.
Next, check the two groups people tend to miss. Is the 30 minutes of jams made of many short stops? If yes, the machine signal found them and the paper log would not have.
Is the waiting time always the same material or the same shift? The record now shows that pattern, which a weekly summary hides.
How your definition moves availability
The 20 minutes of micro-stops go to performance, so run time is 340 minutes in every case below. Only the definition changes.
| Plant definition | Planned time | Downtime | Availability |
|---|---|---|---|
| CIP and changeover both count as downtime | 480 min | 140 min | 340 / 480 = 71% |
| CIP taken out, changeover counts | 440 min | 100 min | 340 / 440 = 77% |
| CIP and changeover both taken out | 395 min | 55 min | 340 / 395 = 86% |
Same line, same shift, same product made. Comparing 71% on one line with 86% on another tells you nothing until the definitions match.
Only then decide what to improve, using the guide to reducing downtime linked above.
Common mistakes
- Too many codes. Operators pick the first one, or "other".
- Counting CIP as failure. Planned cleaning belongs in its own group.
- Treating planned time as free. Changeovers and cleaning still use line hours, so keep measuring them.
- One rated speed for every format. It hides real speed loss.
- Blaming the wrong machine. Starved and blocked time is a symptom, not a cause.
- Reasons entered at the end of the shift. Memory is poor after eight hours.
- No feedback. If operators never see the result, they stop entering reasons.
What good looks like
- Every stop has a start and an end, and every stop above your set length has a reason.
- Unclassified time is a small share of total stop time.
- Planned, changeover and unplanned stops are reported apart.
- Micro-stops are counted and shown separately.
- The team looks at the data at every shift handover.
Availability then becomes something you can trust. See OEE availability for how stops feed the number.
How Fabrico handles this
Fabrico is a cloud light MES focused on OEE and downtime. It is not a full MES: production planning and scheduling are not part of it yet, and job dispatching, BOMs and routings are not included.
- It reads cycles and stops from a PLC, or from an IoT device with external sensors. AI cameras count output and detect cycles where there is no machine signal.
- Each stop on a connected machine is recorded with its start time and duration, and micro-stops are detected from the machine signal.
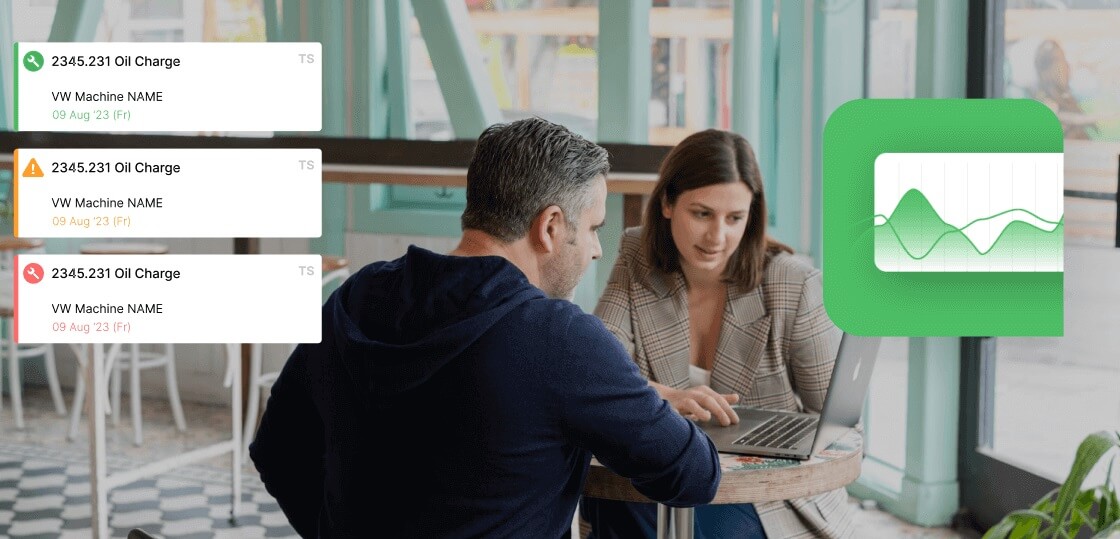
- When a line is down, a card shows the stop time and three quick actions: Add stoppage reason, Start changeover and Task.
- Operators tag the cause of each stop on a tablet or phone, from your own list of reason codes.
- Downtime is shown by cause, machine and shift, next to a live OEE view by line.
- Good parts and scrap can be entered on a tablet where no sensor counts them.
See Fabrico MES and OEE and the downtime tracking software review.
What people ask next
Can I start with a paper log or a spreadsheet?
Yes, if you have nothing today. Record the machine, start, end, reason, shift and a short note. It will miss the short stops and round the times, so treat it as a first step.
Should CIP count as downtime?
Track it either way, as its own planned group. Whether it lowers OEE depends on your plant's own definition, so write the rule down. Set a standard length and code overruns separately.
How long should a stop be before we ask for a reason?
There is no fixed standard. Two minutes is a reasonable start. Shorter stops are counted as micro-stops from the machine signal.
Can I track downtime on old machines?
Yes. An IoT device with an external sensor can read a machine that has no usable PLC data.
What is the difference between OEE software and downtime tracking?
Downtime tracking records stops and reasons. OEE software also takes speed and good count data, and works out availability, performance and quality.
How do I put a cost on a stopped hour?
Use the free field guide at why lines stop.
Ready to see it on your own lines? Request a demo or Contact us.