Login
 Blog
Asphalt Plant Production Tracking: Tons per Hour, Batches and Stops

In short: Asphalt plant production tracking means knowing, hour by hour, how many tons you made, how long the plant really ran, and why it stopped. End-of-day paper tickets only give you the total.
- Track tons per hour against the hours the plant could have run, not only against the hours it ran.
- Count batches on a batch plant. Use the belt scale or plant totals on a drum plant.
- Reconcile truck scale tickets with plant data every day. They answer different questions.
- Log every stop with a reason: breakdown, silo full, weather, no material, planned stop.
- Count OEE in tons, and write down which hours count as planned. Report utilisation next to it.
What you need to track at an asphalt plant
A plant makes several mixes for many customers, in bursts, often against a paving schedule it does not control.
That is why the daily total hides the problem. Two plants can make the same tons and lose very different amounts of time.
Five things give you the full picture. The lists in this guide are general practice, so adapt them to your plant.
- Tons per hour, while the plant is running and averaged over the shift.
- Batch count (batch plants) or belt scale flow (drum plants).
- Run time and stop time, with a reason on every stop.
- Silo and truck data, including waiting.
- Aggregate moisture, weather and demand, kept apart from plant faults.
Tons per hour: pick one definition and write it down
"Tons per hour" sounds simple. It is not, because the divisor can change.
Divide by run hours and you get one number. Divide by shift hours and you get a much lower one.
So define three rates and keep them apart:
| Rate | Divide tons by | What it tells you |
|---|---|---|
| Running rate | Hours the plant was producing | How fast the plant runs when it runs |
| Shift rate | Scheduled shift hours | What the shift really delivered |
| Rated rate | Nameplate capacity (not a division) | The ceiling. Dryers are rated at a set aggregate moisture, typically 5% |
The gap between the running rate and the shift rate is lost time. The gap between the running rate and the rated rate is lost speed.
Both gaps are worth money. They need different fixes.
Example: one shift (example data)
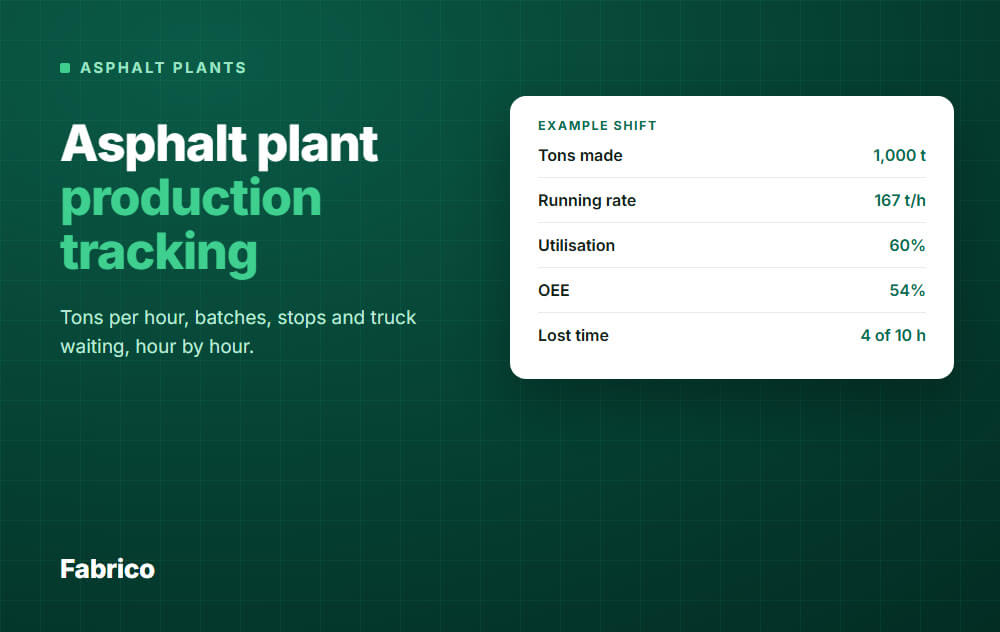
An example 10-hour shift on a drum plant with a rated 200 tons per hour:
- Tons made: 1,000.
- Hours producing: 6.
- Running rate: 1,000 / 6 = about 167 tons per hour.
- Shift rate: 1,000 / 10 = 100 tons per hour.
- Rated output over 10 hours: 2,000 tons.
The plant ran at 83% of its rated speed (167 of 200). It ran for 60% of the shift (6 of 10 hours), so the 4 lost hours are the bigger story.
Why the running rate sits below the rated rate
Do not read every speed gap as a plant fault. Two causes are common.
- Wet aggregate. Drying sets the plant's overall rate, so higher moisture means less feed. Check moisture at least twice a day and log it next to the rate.
- Paving demand. In a balanced job, the paver and the plant run at the same rate. A plant held back to match the paver is not running badly, so tag it.
Batch plants and drum plants need different counters
A batch plant makes mix in individual batches. A drum plant makes it in a continuous flow, so you count differently.
Batch plant: count the batches
Aggregate is weighed in a weigh hopper and binder in a weigh bucket or tank, then both are mixed in a pugmill. Typical batches are about 1.5 to 5 tons.
Each batch is a clear event, and automatic recording systems log batch weights. Batches per hour times average batch weight gives tons per hour: 60 batches of 3 tons is 180 tons per hour (example data).
Track these:
- Batches per hour.
- Average batch weight, and how many were off target.
- Time between batches. A long gap means waiting, not mixing.
- Mix recipe per batch, so you can see changeovers between mixes.
Drum plant: track the flow
There are no batches. A belt scale on the main cold feed conveyor weighs the aggregate before drying, and binder is metered against that flow.
The moisture figure is used to work out dry weight. If it is wrong, your tons are wrong too, so treat moisture checks as part of production tracking.
Track tons per hour, plus the times the drum is turning with no flow.
Truck scale tickets vs plant data
These two sources are often treated as one. They are not.
| Truck scale ticket | Plant data | |
|---|---|---|
| Measures | What left the site, per truck | What the plant made, over time |
| Strength | Billing proof, matches the customer | Shows speed, stops and gaps |
| Weakness | Says nothing about stops or speed | Does not prove what was delivered |
| Timing | When the truck weighs out | When the mix is produced |
The timing difference matters. Mix can sit in a silo, so produced tons and shipped tons will not match hour by hour.
Compare them over a full shift or day. If the daily gap keeps growing, look for mix left in silos, rejected loads, waste, a wrong moisture input, or a scale that needs checking.
To test a scale, weigh random loads on another certified scale. Use tickets for money, and plant data for performance.
Stops: log them with a reason
A stop without a reason is only a gap on a chart. Give operators a short list they can pick in a few seconds.
A starting list for an asphalt plant:
- Breakdown: cold feed, dryer, burner, baghouse, conveyor, screen, mixer.
- Silo full or no trucks: nowhere for the mix to go.
- No demand or no order: the paving crew is not running.
- Weather: rain, cold, wind, site closed.
- Material: aggregate, binder or RAP not available.
- Changeover: switching mix type.
- Start-up and shutdown: known in advance, but you can shorten them.
- Planned: scheduled maintenance, breaks.
Weather and no demand are not the same as a breakdown. Keep them in their own groups so they do not drown out the stops you can fix.
Review the top three reasons every week. A Pareto of stop time shows where to act first, as our guide to the Pareto analysis of downtime explains.
Ten 2-minute stalls cost 20 minutes a shift, or about 67 tons at 200 tons per hour (example data). Read more about micro-stops.
Silos and trucks: the loss the plant cannot see alone
Storage silos exist to stop paving interruptions and truck shortages from shutting the plant down. So a late truck does not stop a plant straight away, it fills the silo.
The silo is not a free buffer. Long storage can age the binder, and some state specifications limit storage time.
Plants that load straight from the pugmill have no such cushion. Track three things:
- How long each truck waited to be loaded.
- Silo level through the shift.
- Hours the plant stopped with silos full or no trucks.
If the plant often stops with full silos, look at dispatch and the paving schedule. If trucks often queue, look at plant rate or loadout.
Without both numbers, each side blames the other.
Utilisation vs OEE at an asphalt plant
OEE multiplies availability, performance and quality. It works here if you count in tons instead of parts, and you can read the basics in OEE calculation.
- Availability = hours producing / planned production hours.
- Performance = running rate / rated rate.
- Quality = good tons / tons made (waste, rejected loads and off-spec mix are the losses).
Utilisation is a separate number: hours producing / all shift or season hours, with nothing taken out. It shows the real use of expensive equipment.
Decide the planned time before you measure
The hard part is which hours count as planned. If the plant sits idle because no paving job is booked, that is a market loss, not a plant loss.
Here is a rule that works. It is general practice, not a standard:
- Left out of planned time: no job booked, weather stops, scheduled maintenance, breaks.
- Kept in planned time: breakdowns, start-up, changeover, material shortages, silo full or no trucks.
Start-up stays in because you can shorten it. Silo full stays in, but keep it as its own reason, because the plant team cannot fix it alone.
Example: the same shift, two views (example data)
The 10-hour shift had 1 hour of start-up, 1 hour of rain, 1 hour with silos full and no trucks, and a 1-hour fault. It made 980 good tons out of 1,000.
| Measure | Calculation | Result |
|---|---|---|
| Utilisation | 6 h producing / 10 h shift | 60% |
| Availability | 6 h producing / 9 h planned (rain left out) | 67% |
| Performance | 167 / 200 t/h | 83% |
| Quality | 980 good t / 1,000 t made | 98% |
| OEE | 0.67 x 0.83 x 0.98 | about 54% |
You can check it: 980 good tons / (9 hours x 200 tons per hour) is also about 54%. Count the rain hour as planned and the same shift shows 49%, which is why the rule must be written down.
Where the data comes from
Paper tickets cannot show the hour-by-hour picture. You need a signal from the plant.
The main sources:
- Plant control system: check what it logs and exports first. Some makers sell reporting modules: Ammann's as1 PIP, for example, lists KPIs, live production, faults and daily trends.
- PLC signals: run, stop, flow, batch complete.
- Sensors: a current sensor on the drum motor shows the drum turning, but not tons. A loadout gate signal shows when mix is leaving.
- Truck scale: truck weights and times, usually in a separate system.
Every plant is wired differently, and older plants may have no data port at all. If your control system already gives you shift rates and stop reasons, start there.
Check your air permit too. Some states require daily production records, so you may need to keep that log anyway.
How Fabrico fits
Fabrico is a light MES for OEE and production monitoring. It collects data from PLCs, IoT sensors on older machines and AI cameras, and operators tag each stop's cause on a tablet or phone, using your own reason codes.
You see whether a line is running or stopped, how long a stop has lasted, and its cause once tagged. You also get output, stops and OEE per shift, downtime by cause, and micro-stops from the machine signal, with export to Excel or CSV.
We have no asphalt-plant references to show you, and no ready connection to any plant control system. Fabrico counts cycles, units and parts, so whether your tonnage signal can feed it is the first thing to check.
It does not replace your truck scale system, billing or job dispatching. Installing and connecting devices takes about one month, and a full rollout takes 3 to 4 months.
See Fabrico MES and OEE for the product itself. To check it against your plant's signals, Request a demo or Contact us.
Common mistakes
- Reporting only one tons-per-hour number with no divisor stated.
- Counting weather and no-demand hours as plant failures.
- Using truck scale tickets as a measure of plant speed.
- Reading a wet-aggregate day as a slow crew.
- Letting "other" become the biggest stop reason.
- Comparing plants on raw tons per hour without looking at rated capacity and moisture.
- Rolling out a tracker before checking what signals the plant can give.
What people ask next
What is a good tons per hour for an asphalt plant?
There is no single figure, because drum plants alone range from about 100 to over 900 tons per hour by design. Compare your running rate to your own rated capacity at your moisture level, and track the trend over weeks.
Can I track a drum plant without batches?
Yes. Use the belt scale flow or plant totals, and log run and stop states.
Should weather stops count against OEE?
Decide once and write it down. We suggest leaving weather out of planned time for OEE and keeping it in utilisation, so you can still see it.
How do I know which stops to fix first?
Rank stop time by reason and start with the top one you can control.
What does a stopped hour cost?
Multiply the lost tons by your contribution margin per ton, and only count tons you could have sold and cannot make up later. Our free field guide, why lines stop, helps you price it.
Do I need new software, or can I use spreadsheets?
Spreadsheets work for totals, but they struggle with live stop reasons and hourly rates. Check your control system's reports first, then decide what is still missing.
Want to see what your plant signals can show? Request a demo or Contact us.
Latest from our blog