


 Login
 Blog
GE Vernova to Expand Its Shreveport Transformer Plant: Find Capacity Before You Hire

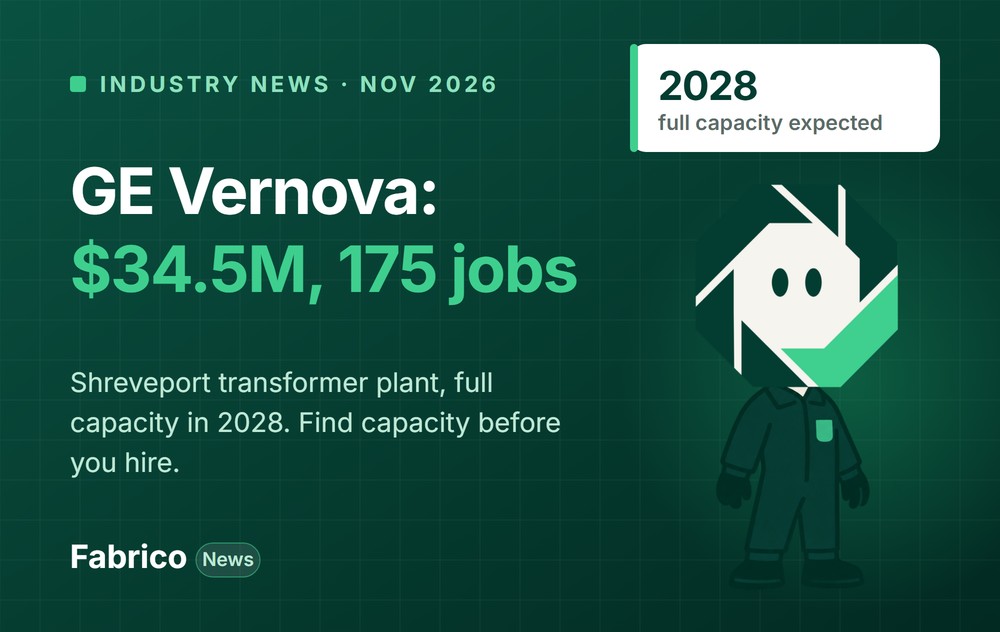
In short: On 10 November 2026 GE Vernova said it will invest $34.5 million to expand transformer manufacturing at its plant in Shreveport, Louisiana, adding 175 direct jobs to more than 630 today. Full production capacity is expected in 2028.
- GE Vernova links the expansion to growing demand for grid equipment.
- Before a plant adds a shift or a bay, the cheaper capacity is often the time its current stations already lose.
- Below: what GE Vernova announced, the numbers in context, what it means for plant, production and maintenance managers, and a checklist for this quarter.
News, 13 November 2026. Every news figure below comes from a linked source, and the full list is at the end.
What GE Vernova announced on 10 November 2026
In a press release, GE Vernova set out its plan for the Shreveport site, which makes industrial and renewable energy transformers.
- Investment: $34.5 million to expand transformer manufacturing, with a $300,000 performance-based grant from the state for site and infrastructure work.
- Jobs: 175 new direct jobs on top of more than 630 existing positions. Louisiana Economic Development (LED) estimates about 185 more indirect jobs; the estimate appears in the joint release, and LED had not posted it on its own site when we checked on 14 November 2026.
- Site: a facility of about 500,000 square feet that has made transformers since 1970.
- Timing: full production capacity is expected in 2028.
- Wider plan: the company describes nearly $1.3 billion of investment across its US manufacturing sites and research centres from 2025 to 2028.
The release links the expansion to growing demand for grid equipment. It gives no figures on output per year or on lead times, so we make no claim about either.
The numbers behind the news
Every figure in this table is from GE Vernova's release of 10 November 2026, which it issued together with Louisiana Economic Development (LED).
| Item | Figure in the release |
|---|---|
| Investment in Shreveport | $34.5 million |
| State grant | $300,000, performance-based, for site and infrastructure work |
| State programs | Quality Jobs and Industrial Tax Exemption (expected) |
| New direct jobs | 175 |
| Existing positions | more than 630 |
| Indirect jobs (LED estimate) | about 185 |
| New job opportunities in Northwest Louisiana | 360 |
| Site size | 500,000 square feet |
| Ground broken / transformer production since | 1969 / 1970 |
| Full production capacity | 2028 |
| Company plan for US sites and research centres | nearly $1.3 billion, 2025 to 2028 |
Two ratios follow from these figures; they are our arithmetic, not the company's. The investment works out at about $197,000 per new direct job ($34.5 million / 175). And the workforce grows by about 28% (175 on top of 630), so more than one person in five at the site in 2028 will be new.
The release names the work: new manufacturing equipment, process changes and supporting infrastructure across key production areas, to raise output of industrial and renewable energy transformers. It does not say how many units a year the site makes today, how many it will make in 2028, or what its lead times are. Those are the numbers a customer would care about most, and they are not public, so we do not estimate them.
Background: why grid equipment makers are adding capacity
The squeeze on transformers is documented. A February 2024 report from the National Renewable Energy Laboratory (NREL) found that US utilities faced lead times of up to 2 years for transformers, about four times the level before 2022, and that prices had risen by as much as 5 to 6 times in two years. NREL put the causes down to post-pandemic demand, workforce shortages, component supply problems and short supply of materials such as grain-oriented electrical steel, aluminium and copper.
That report looks at distribution transformers and describes 2024. Larger units were tighter still. In August 2025, Wood Mackenzie estimated US supply deficits of 30% for power transformers and 10% for distribution transformers in 2025, with demand up 116% and 41% since 2019, imports covering about 80% and 50% of supply, and more than $1.8 billion of North American capacity expansions announced by manufacturers since 2023.
Demand for electricity keeps rising. The US Energy Information Administration's November 2026 Short-Term Energy Outlook, released on 10 November 2026, the day of GE Vernova's announcement, forecasts US power sector generation up 2.7% in 2026, to 4,539 billion kWh, and up 1.2% in 2027, with commercial demand driving the growth.
Shreveport has seen this before. In April 2023 LED announced a Prolec GE expansion in Shreveport of up to $28.5 million, with a third production line, 153 new direct jobs and 282 retained, for transformers used by wind farms, solar parks and industry. In February 2026 GE Vernova completed its $5.275 billion purchase of the rest of Prolec GE, about 10,000 employees at seven sites in the Americas, five of them in the US; Prolec GE now goes to market as GE Vernova. None of these figures describe the output of the Shreveport plant. They explain why makers of grid equipment keep adding capacity, and why two of the constraints NREL names, people and materials, are ones a new bay cannot fix on its own.
Why the capacity you already own comes first
Many discrete manufacturers are in the same position: orders are there, lead times are long, and the plant is full. The usual answer is more floor space, more machines and more people, and in a tight market those take years and are hard to hire.
Two things are worth checking before and during an expansion like this. First, how much time the existing stations lose each week to waiting, changeovers and stops. Second, how fast new people reach the output of experienced ones. Both decide how much of the planned capacity actually shows up in 2028.
We have no view of how GE Vernova runs its plant and make no guess about it. The questions apply to any plant that is adding capacity.
Capacity you already own: a worked example
Example data, not GE Vernova's. An assembly area with 6 stations, each planned for 80 hours a week.
| Loss per station | Hours a week | Assumed cut (example) | Hours back |
|---|---|---|---|
| Waiting for parts or cranes | 10 | a third less | 3.3 |
| Rework and test repeats | 6 | a quarter less | 1.5 |
| Changeovers between designs | 8 | a quarter shorter | 2 |
Each station gets back 3.3 + 1.5 + 2 = 6.8 hours a week. Across 6 stations that is 6 x 6.8 = 40.8 hours, about half of one more station's 80 planned hours, without new floor space. The cuts are assumptions for the example; your own loss log sets the real ones.
In money (Example data). Assume each station hour of output carries $1,200 of contribution margin, the sales value minus materials and other variable costs. Then 40.8 hours a week is 40.8 x $1,200 = $48,960 a week, or about $2.35 million a year over 48 working weeks (48 x $48,960 = $2,350,080). Use your own margin per hour; the method is the same.
Planning more stations or another shift? Book a demo and see waiting, rework and changeovers per station.
What it means for plant, production and maintenance managers
For the plant manager: commit on what the floor has shown
An expansion like this has three dates that rarely line up: when the equipment is installed, when the new people are trained, and when the customer was promised the extra output. The safest commitments are built on demonstrated output, the good units the plant actually shipped per week over the last two or three months, not on the nameplate of the new equipment. When more than one person in five is new, as the Shreveport figures imply, the gap between nameplate and demonstrated output can last for months. A plant manager who can see weekly good output per area, next to the hours planned, can tell the board and the customers when the gap closes, instead of hoping it does by the target year.
For the production manager: protect the constraint during the build
Equipment going into a running plant means some stations are fenced off, cranes are shared with installers and test slots are booked twice. Work that is built to a customer's design, as much heavy electrical equipment is, also brings frequent changeovers between designs. The production manager's job in this period is to know which station limits output each week and to keep it fed: parts staged before the shift, crane time reserved, test slots planned in the schedule rather than found on the day. Pairing each new hire with an experienced operator on that station, and tracking both teams' output per hour, shows whether the ramp is on plan.
For the maintenance manager: plan for early-life failures
New machines often fail more in their first weeks than later, while older machines in the same plant are being pushed harder to cover the gap. Both need a plan. For new equipment: preventive maintenance tasks, spare parts and the supplier's contact are in place before acceptance, and each stop in the first 90 days is logged with a reason, so repeat faults are raised with the supplier while the warranty still applies. For older equipment: list the machines whose failure would stop the constraint, check their spares, and agree PM windows with production now, not in the middle of the ramp.
Three steps to find capacity before you hire for it
- Measure each station in hours lost. Run, stop and wait time per station and shift, taken from machines or simple sensors. Our guide to OEE monitoring software covers the options.
- Code waiting separately. Waiting for parts, cranes or test slots is not a machine problem, and it can be one of the biggest losses in heavy assembly.
- Track the ramp of new hires. Compare output per hour of new and experienced teams each week, so training gaps show up early, not at year end.
What to do this quarter
- Name the constraint. Look at where work queues longest each week: a station, a crane, a test bay. Put a weekly owner on it.
- Write down demonstrated output. Good units per week, per area, averaged over the last 8 to 12 weeks. Use this, not nameplate, in every customer promise.
- Map installation windows. For each piece of new equipment, list which existing stations lose time during installation, for how many shifts, and the output that costs.
- Build a skills matrix. For each station and shift, who is qualified to run it. Aim for at least two qualified people per station per shift before the new hires arrive.
- Set a ramp target for new hires. For example, 50% of an experienced team's output per hour by week 4 and 80% by week 12, reviewed every week. Pick your own numbers; the point is to write them down.
- Prepare maintenance before acceptance. PM plans, spare parts and stop codes for each new machine, and a 90-day stop log with reasons.
- Hold one short capacity review a week. Three numbers per area: planned hours, hours lost by cause, good output. Decide one action per area.
Where OEE and light MES help
Station-level OEE shows where a full plant still loses time, by loss type. A light MES adds orders, designs and the reasons operators enter on a tablet, so waiting, rework and changeovers are visible per station and per shift. Comparing tools before an expansion? Our review of manufacturing productivity platforms sets out the main types.
Which OEE factor an expansion touches most
In heavy assembly, the biggest losses usually show up in availability: waiting for parts, cranes or test slots, and changeovers between designs. Performance and quality losses exist too, but a station that is waiting cannot be fast or slow.
Example data. A station planned for 80 hours a week runs for 56 of them, so its availability is 56 / 80 = 70%. If the 3.3 hours of waiting from the table above come back, it runs 59.3 hours, and availability rises to 59.3 / 80 = 74.1%. Across the 6 stations in the example, that is about 20 hours a week (6 x 3.3) from one loss type alone, before any new equipment is switched on.
How Fabrico does it
Fabrico is a cloud OEE and light MES platform. It shows OEE and losses by station, line and shift from the PLC or a Fabrico IoT device, with the reasons operators add on a tablet or phone. On manual stations, AI cameras (an add-on) count output. We have no link to GE Vernova; the figures above are from its release.
Adding capacity in the next two years? Book a demo.
What people ask next
How much is GE Vernova investing in Shreveport?
GE Vernova said on 10 November 2026 that it will invest $34.5 million to expand transformer manufacturing in Shreveport, Louisiana, with a $300,000 performance-based state grant.
How many jobs will the Shreveport expansion create?
175 new direct jobs on top of more than 630 existing positions. Louisiana Economic Development estimates about 185 more indirect jobs. Full production capacity is expected in 2028.
How can a plant add capacity without new floor space?
Measure the hours each station loses to waiting, rework and changeovers, then cut the biggest losses first. Small cuts across several stations can add up to most of a new station. See our guide to OEE monitoring software.
Why are transformer lead times so long?
NREL's February 2024 report found that US utilities faced lead times of up to 2 years for transformers, about four times the level before 2022, with prices up by as much as 5 to 6 times in two years. It named post-pandemic demand, workforce shortages, component supply problems and short supply of electrical steel, aluminium and copper as causes. The report covers distribution transformers.
What will GE Vernova's Shreveport expansion change?
According to the 10 November 2026 release, the $34.5 million funds new manufacturing equipment, process changes and supporting infrastructure across key production areas, to raise output of industrial and renewable energy transformers. The site has made transformers since 1970 and expects full production capacity in 2028.
How long does it take a new hire to reach full output?
There is no standard figure; it depends on the task and the training. The practical answer is to measure it: track output per hour of new and experienced teams on the same station every week, and set targets such as 50% by week 4 and 80% by week 12, then adjust them to what you see.
Sources
All sources accessed on 14 November 2026. Dates are the publication dates shown on each page.
- GE Vernova, press release on the Shreveport facility expansion, 10 November 2026
- Wood Mackenzie, Power transformers and distribution transformers will face supply deficits of 30% and 10% in 2025, 14 August 2025
- US Energy Information Administration, Short-Term Energy Outlook, November 2026: electricity, 10 November 2026
- Louisiana Economic Development, Prolec GE Shreveport Facility Expansion to Create 153 New Jobs, 25 April 2023
- GE Vernova, GE Vernova completes Prolec GE acquisition, 2 February 2026
- National Renewable Energy Laboratory, Major Drivers of Long-Term Distribution Transformer Demand (NREL/TP-6A40-87653), 1 February 2024
Related articles





Latest from our blog





Real Fabrico tiles, sample data.