


 Login
 Blog
AVEVA PI vs Canary: Tag History, Context and Scale Compared

In short: AVEVA PI vs Canary is a choice between two time-series historians that reach the same jobs by different routes: AVEVA PI System pairs the PI Server archive with Asset Framework models, while Canary pairs its historian with Virtual Views built from rules over tag names.
- Both collect from OPC UA and MQTT sources; AVEVA's Adapters also list Modbus TCP, RDBMS and BACnet, and Canary's collectors list SQL tables and CSV files.
- Context is modelled in Asset Framework on the AVEVA side and applied after archiving with Virtual Views on the Canary side.
- Across sites, AVEVA points to CONNECT and Edge Data Store; Canary points to local plus enterprise logging, Store and Forward and the Views service.
- The worked example: two sites store one counter at 5 and 60 second scans, and a corporate OEE roll-up compares them unfairly.
One plant runs PI, another runs Canary, and the corporate OEE report has to make sense of both. Below: the two products job by job, then one line counter followed from two sites into a roll-up.
AVEVA PI vs Canary at a glance
Every cell is taken from the vendor's own pages, as of 14.11.2026, and the links sit in the sections below.
| Job | AVEVA PI System | Canary |
|---|---|---|
| How it is described | A suite of operational data management software | A historian with collectors, views and trend tools |
| Tag history | PI Server: up to twenty million tags per server | Canary Historian: same build on site and enterprise |
| Collection | PI Interfaces and Connectors, AVEVA Adapters | Collectors for OPC DA and UA, MQTT, SQL, CSV |
| Context | Asset Framework: templates and asset models | Virtual Views: regex rules after archiving |
| Reading back | PI Vision, PI SQL, PI Web API | Axiom, Excel Add-in, ODBC, Web API |
| Many sites | CONNECT in the cloud, Edge Data Store | Site plus enterprise logging, Store and Forward |
How AVEVA describes PI System
AVEVA's product page for PI System opens with the line "AVEVA PI System is a trusted suite of integrated, operational data management software." As of 14.11.2026, these are the parts it and the linked product pages describe:
- PI Server. The PI Server page says one server is "capable of managing data for up to twenty million tags or data streams".
- Collection. The PI System page lists PI Interfaces, PI Connectors and AVEVA Adapters among its connectivity products and promises data "with sub-second granularity". An AVEVA blog on CONNECT says the Adapters "support OPC UA, Modbus TCP, MQTT, RDBMS, DNP3, Azure Event Hubs, Structured Data File, BACnet, and more."
- Asset Framework. The PI Server page says the asset framework "enhances raw data streams with critical metadata and contextual data". An AVEVA blog on Asset Framework adds that it "supports templates, which allow users to create commonalities between different objects."
How Canary Labs describes its system
Canary Labs lays its system out on the How It Works page in steps from collection to analysis. As of 14.11.2026:
- The historian. The historian page frames the load with "Imagine the amount of data that can be produced if you have 5,000 tags sending values every second." It also says "the same solution works as well on site as it does for the entire enterprise."
- Collectors. The data collectors page claims "strong support for both OPC DA and OPC UA across our platform". Its Sparkplug B connector lets you "subscribe to MQTT topics, filter which tags you wish to historize", and "The SQL collector can convert existing SQL historic databases or monitor new inserts into existing tables".
- Virtual Views. The Virtual Views page states "Modeling data should be done post-archiving." Rules are written with regular expressions, and "a single tag within the Historian can belong to multiple asset models."
- Reading back. The How It Works page lists "Historical data requests via the Excel add-in, Axiom, or ODBC." The Excel Add-in page adds a Last Value function "to pull the last known data for large lists of tags."
AVEVA PI vs Canary, job by job
Storing and retrieving tag history. AVEVA leads with precision over time: PI Server is meant to "Securely maintain the original precision, integrity, and availability of time-series data from critical operations." Canary leads with throughput and one build from site to enterprise. For retrieval, AVEVA names PI Vision, where users can "Analyze multiple trends together, compare live data, and troubleshoot issues without predefined dashboards", and, on its developer technologies page, PI SQL, which "lets users execute SQL queries against the time-series data stored in AVEVA PI Server." Canary names Axiom, the Excel Add-in and an ODBC Connector for SQL clients.
Collection. AVEVA groups collection into PI Interfaces, PI Connectors and AVEVA Adapters, and its Edge Data Store offers "No-code connectivity via OPC UA and Modbus TCP". Canary runs collectors per source: OPC, Sparkplug B, SQL and CSV. On rates, a Canary support answer in the help centre says the collector sample interval "is a “suggested” update rate for the OPC server to use" and "this can be overwritten by the OPC server". Whichever product you run, check the rate a tag is actually stored at, not just the rate that was requested.
Asset or virtual views. This is the clearest difference in approach. AVEVA puts models in Asset Framework and says on the PI System page that you can "Configure reusable asset models, events and analytics based on multiple data streams and conditions without programming." Canary builds models on top of stored tag names. Its Virtual Views primer for version 26 says "Multiple Virtual Views can be built." and "One Virtual View does not have to suit all use cases." The How It Works page sums up the effect: "Change tag names without changing the tag in the archive". A team that likes engineered templates per machine type will read AVEVA's pages closely; a team with consistent tag names and many audiences will read Canary's.
Scale across sites. AVEVA says you can "Aggregate data from multiple sites in the cloud to support enterprise analysis" through CONNECT, and its Edge Data Store page says remote data is buffered and "then forwards that data to AVEVA PI Server or CONNECT when communications become available." Canary's historian page says "You can log data locally, while sending it to your enterprise historian simultaneously." Its architecture options article for version 25 adds that "Each SaF service has the ability to push data in real-time to multiple destinations enabling redundancy", that "the Views service can be used to stitch together multiple Canary Historians", and that "Canary System components may be installed in cloud solutions."
How each connects to other systems. AVEVA lists the PI Web API, a RESTful API to "retrieve and manipulate time-series data, asset metadata and events", plus the AF SDK and PI Integrators. Canary's data connectors page says "Canary makes it easy to publish your data to third party applications." It lists a Web API that "connects through the Views Service", MQTT publishing and connectors for analytics tools. On the wire, both lean on OPC UA, whose OPC Foundation page says "The OPC UA information modeling framework turns data into information." Protocol trade-offs are covered in OPC UA vs MQTT, and where computing should run in edge vs cloud shop floor data.
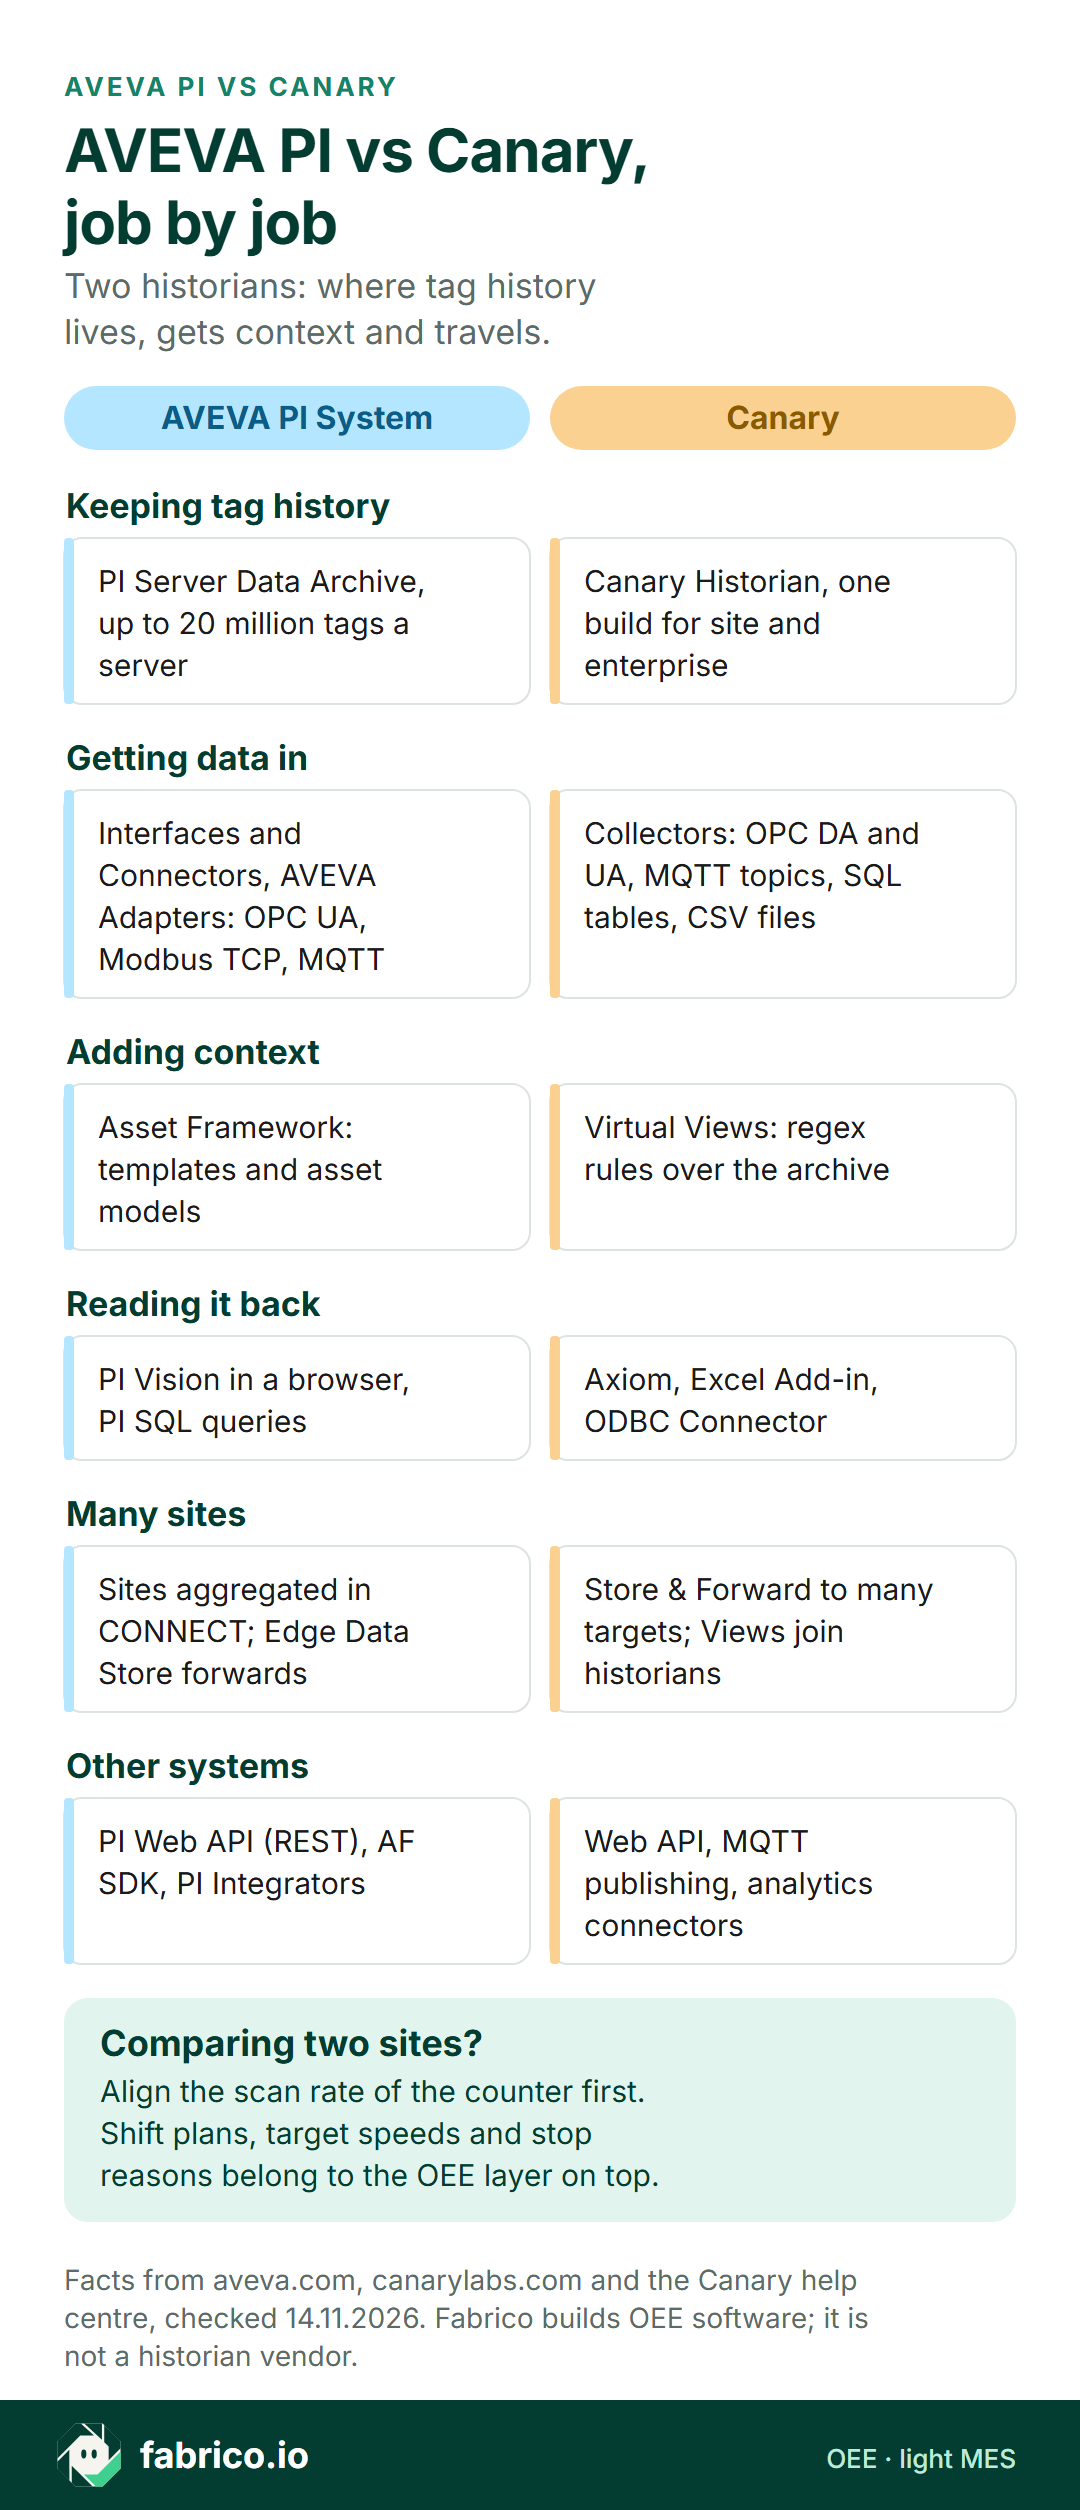
Text version of this infographic
- AVEVA PI vs Canary, job by job. Two historians: where tag history lives, gets context and travels.
- Keeping tag history. AVEVA PI System: PI Server Data Archive, up to 20 million tags a server. Canary: Canary Historian, one build for site and enterprise.
- Getting data in. AVEVA PI System: Interfaces and Connectors, AVEVA Adapters: OPC UA, Modbus TCP, MQTT. Canary: Collectors: OPC DA and UA, MQTT topics, SQL tables, CSV files.
- Adding context. AVEVA PI System: Asset Framework: templates and asset models. Canary: Virtual Views: regex rules over the archive.
- Reading it back. AVEVA PI System: PI Vision in a browser, PI SQL queries. Canary: Axiom, Excel Add-in, ODBC Connector.
- Many sites. AVEVA PI System: Sites aggregated in CONNECT; Edge Data Store forwards. Canary: Store & Forward to many targets; Views join historians.
- Other systems. AVEVA PI System: PI Web API (REST), AF SDK, PI Integrators. Canary: Web API, MQTT publishing, analytics connectors.
- Comparing two sites? Align the scan rate of the counter first. Shift plans, target speeds and stop reasons belong to the OEE layer on top.
- Facts from aveva.com, canarylabs.com and the Canary help centre, checked 14.11.2026. Fabrico builds OEE software; it is not a historian vendor.
Pick by the job you need first
Which of these is on the plan for next quarter? Many groups run both products for a while.
| First job | Look at first |
|---|---|
| Engineered asset templates reused across many similar machines | AVEVA PI System and Asset Framework |
| Several audiences wanting different views of the same tags | Canary and Virtual Views |
| Remote assets with weak links, buffered and forwarded | Both: Edge Data Store, or Store and Forward |
| A mixed estate: PI at some sites, Canary at others | Both side by side, with naming and scan rates agreed |
| Line OEE with reasons typed in by operators | An OEE layer that takes signals next to either historian |
What any plant historian is for, and what to check before buying one, sits in our manufacturing data historian guide. If AVEVA is also on the SCADA shortlist, see AVEVA vs Ignition and AVEVA vs Proficy.
Where OEE, plans and stop reasons come in
A historian keeps values against time: a counter, a run bit, a speed. OEE multiplies availability, performance and quality, and three of its inputs are context: how long the line was planned to run, the ideal rate of the product on it, and why it stopped. The PLC knows the filler halted at 10:42. The operator knows the tube magazine jammed.
Per ISA, ISA-95 sets out levels of plant systems, and "it outlines how an enterprise can set up an interface to communicate among these layers". Historians sit close to control; OEE with reasons is operations work above it. Whichever historian you run, decide who enters stop reasons, on what screen, and which system owns the official OEE figure. The arithmetic is set out in OEE calculation.
Where Fabrico fits beside PI or Canary
Fabrico does not sell historians, SCADA, HMI or connectivity software, so a plant keeps PI or Canary for process history. Fabrico is a cloud platform for OEE and light MES; the solution overview lists what it covers.
- Signals from the machine. The machine side arrives as run state, stops and counts, wired from the PLC, an added sensor or a counter. OPC UA and MQTT both appear on the machine connectivity page.
- Reasons from people. Operators tap why the line stopped on a tablet or phone, and Fabrico shows OEE, downtime and losses, with losses also in money, for each line and shift, on a laptop or in the phone apps for iOS and Android.
- Manual stations. Where no usable signal exists, the camera add-on counts finished units. A camera add-on feature that proposes the stop reason is a Roadmap item. The camera add-on streams its video on request and does not store it. The computer vision for FMCG hub and computer vision for cosmetics show where it fits.
- Data out. Results go out through REST API calls, webhooks, or Excel and CSV downloads, to sit next to the historian's trends.
For how buyers score OEE tools, see OEE software. To see shift OEE with operator reasons, book a demo.
Worked example: two sites, one counter, two scan rates
Sample data for illustration, not a customer or a product screen. A personal care group runs the same toothpaste tube filler at two sites. Its corporate OEE roll-up reads historian tags: a scan interval in which the good-tube counter did not rise counts as stopped time. Site A stores the counter every 5 seconds, Site B every 60. The example holds for either historian, since the scan rate is a setting in both.
The shift, identical at both sites. 600 minutes with a 30 minute break: 570 planned minutes. The ideal rate is 120 tubes a minute, so 68,400 tubes at best. Long stops: a 40 minute changeover and a 15 minute tube magazine fault, 55 minutes. Short stops: 36 of 40 seconds each, 24 minutes. Total stops 79 minutes, leaving 491 running minutes. The filler made 54,600 tubes; 600 went to the reject counter, leaving 54,000 good.
True figures. Availability is 491 / 570 = 86.14%. Ideal output in running time is 491 x 120 = 58,920, so performance is 54,600 / 58,920 = 92.67%. Quality is 54,000 / 54,600 = 98.90%.
OEE is 86.14% x 92.67% x 98.90% = 78.95%
That matches 54,000 good tubes / 68,400 possible.
What Site B's roll-up saw. A 40 second stop can never fill a whole 60 second interval, so the counter rose in every interval that held one, and the 36 short stops vanished. The long stops still showed, here at their full length. Logged running time became 515 minutes: availability 515 / 570 = 90.35%, ideal 515 x 120 = 61,800, performance 54,600 / 61,800 = 88.35%, quality unchanged at 98.90%. Because the counter is cumulative, both sites logged the same 54,600 tubes, so OEE still reads 78.95%.
Why the comparison is unfair. The board ranks sites on availability, so Site B looks better at keeping the filler running, while Site A gets the short stop action list and Site B is told to work on speed. Both lines ran the same shift. The gap is an artefact of storage settings, and the 24 minutes of short stops at Site B never reach anyone who could fix them. More on that loss pattern in reduced speed loss vs minor stops.
After aligning the rates. Site B moves the counter to a 5 second scan and confirms that the source delivers that rate, which matters given Canary's note that an OPC server can override the request. The roll-up then logs 36 short stops at both sites, and both show 86.14%, 92.67% and 98.90%. A sturdier fix is to take run and stop state from the machine signal rather than inferring it from counter gaps, and to agree a minimum stop length per line type.
Questions to ask both vendors
- Where is the collection rate for a single tag set, and how do we see the rate it is really stored at?
- How are asset models built and changed, and what happens to history when a tag is renamed?
- When the network to head office fails, where does site history wait, and how is it sent on later?
- During a migration, can your product read history out of the other product, and at what resolution?
- Which APIs and SQL routes can an OEE or analytics tool use to read raw and aggregated values?
- Which system will hold shift plans, target speeds and operator reasons, and whose OEE number goes to the board?
What people ask next
Is AVEVA PI System the same thing as OSIsoft PI?
AVEVA now presents the product as AVEVA PI System, a suite of operational data management software built around PI Server. Older documents and many plant teams still use the OSIsoft name for the same family.
Where do asset models live in each product?
In AVEVA PI System, models, hierarchies and templates are kept in Asset Framework, part of PI Server. In Canary, Virtual Views apply regular expression rules to tag paths after archiving, and one tag can sit in several asset models.
Does the scan rate change OEE?
It can change the split. In the sample on this page, a 60 second scan hid 36 short stops, so availability read higher and performance lower, while the headline OEE stayed the same. Align the counter scan rate before comparing sites.
Does Fabrico replace AVEVA PI System or Canary?
No. Fabrico is a cloud platform for OEE and light MES. It takes run, stop and count signals from the machine and stop reasons from operators, and it does not sell a historian, so a plant can keep either one.
Want OEE that compares sites on the same terms, with operator reasons attached? Book a demo.
Related articles


Latest from our blog


Real Fabrico tiles, sample data.