


 Login
 Blog
Grafana vs Ignition: Time-Series Dashboards or SCADA Control?

In short: Grafana vs Ignition is a choice between two jobs. Grafana, from Grafana Labs, is open source software for querying, charting and alerting on data that already sits in a database. Ignition, from Inductive Automation, is plant server software for SCADA: it reads PLCs, runs operator screens and alarms, and keeps tag history. Many plants run both, one above the other, and OEE needs a third piece: plan, ideal rate and stop cause.
- Grafana queries a data source such as a SQL database, InfluxDB or Prometheus; Ignition reads controllers through its OPC UA module and drivers.
- A Grafana Stat panel set to Mean over per-shift OEE can sit seven points away from the true day figure, as the sample day further down proves.
- Each vendor claim links to the page it came from: Grafana's docs and Inductive Automation's site and manual, read on 13.11.2026.
On one site the automation team is scoping Ignition for the extrusion hall, while IT already watches its servers in Grafana and asks why the plant needs anything else. Both can be right, because the two tools answer different questions. Below: what each vendor says its product does, the jobs side by side, and the OEE sum that trips up shift charts.
Grafana vs Ignition at a glance
From each vendor's own pages and docs, 13.11.2026; links sit in the sections below.
| Job | Grafana | Ignition |
|---|---|---|
| How the vendor puts it | Query, visualize, alert on and explore data where it is stored | Plant server software that links floor systems |
| Main unit of work | A dashboard of panels | A project: tags, screens, alarms, history |
| Data in | Data sources such as SQL, InfluxDB, Prometheus, plus plugins | OPC UA module with PLC drivers, MQTT modules |
| Alerts | Alert rules on queries, with notifications | Alarms on tags, Alarm Notification module |
| Runs on | Linux, macOS, Windows, Docker, Kubernetes | Servers, laptops, embedded devices |
| Built in | Dashboards and panels in the browser | The Ignition Designer |
What Grafana does, per Grafana Labs
Grafana Labs' About Grafana page, as of 13.11.2026, says Grafana open source software lets you "query, visualize, alert on, and explore your metrics, logs, and traces wherever they are stored", with tools that turn time-series database data into graphs.
- Dashboards and panels. Per the dashboards docs, a dashboard groups one or more panels in rows or tabs for an at-a-glance view. The time series panel is the default way to show values changing over time.
- Data sources. The data sources page defines one as a connection to a storage backend that holds your data. The core list includes InfluxDB, Prometheus, Microsoft SQL Server, MySQL and PostgreSQL; others install as plugins.
- Transformations. Per the transform docs, these reshape query results before drawing; Add field from calculation derives a new field from two existing ones.
- Annotations. The annotations page uses them to mark events on a chart as vertical lines.
- Install. The installation page names Debian, Ubuntu, RHEL, Fedora, SUSE, openSUSE, macOS and Windows, plus Docker and Kubernetes.
What Ignition does, per Inductive Automation
Inductive Automation (IA) introduces Ignition on its overview page, checked 13.11.2026, as server software that works as a central hub for plant-floor systems. Its SCADA software page defines SCADA as software "used to monitor/control industrial processes", fed with real-time data from devices via PLCs or RTUs.
- Designer. IA describes the Ignition Designer as one environment with a component library, data binding, drawing and scripting.
- Modules. IA's module catalogue includes Vision (plant-floor and desktop screens), Perspective (mobile-responsive apps), an OPC UA Module that connects to most major PLCs, Alarm Notification, SQL Bridge, Reporting and Cirrus Link's MQTT modules.
- Tags and history. In the manual's tags chapter, tags hold values that are either fixed or driven by OPC addresses, expressions or SQL queries. A check box on the tag sends its history, via the Tag Historian, into a SQL database.
- Alarms. The alarming chapter configures alarms per tag in the Tag Editor, with filtering, shelving and notes.
- Platform. IA lists SQL, Python, OPC UA and MQTT under its open technologies; Ignition goes onto servers, laptops and embedded devices, and serves web clients from a gateway on premise or in the cloud.
On OEE, an OEE Downtime Module for Ignition appears on IA's Sepasoft partner page, described as pairing OEE calculations with downtime tracking.
Grafana vs Ignition, job by job
Charts over stored data vs operator screens and control. A Grafana dashboard looks back over data another system has already written: a week of melt temperatures, a month of line speeds, the hour before a fault. An Ignition screen sits at the line, live, with setpoints, buttons and alarms the operator acts on, since IA's SCADA definition covers control as well as monitoring. HMI design has its own standard: ISA calls ANSI/ISA-101.01 "a comprehensive framework for designing and managing HMIs in process automation systems". IA's SCADA page also shows charts, so Ignition can carry trends too.
Data sources. Grafana starts from a store: it queries a data source and draws the answer, so plant data must reach that store first. Ignition starts from the controller: the OPC UA Module reads the PLCs, tags hold live values, the Tag Historian writes them to SQL. The OPC Foundation calls OPC UA, released in 2008, "a platform independent service-oriented architecture". One common split follows: Ignition fills the SQL database and a Grafana SQL data source reads it. Ask your integrator how the history tables are laid out before writing panel queries.
Alerting. Grafana Alerting promises to let you "learn about problems in your systems moments after they occur", with rules that run on queries, and the same docs let you choose how, when and where notifications go. Ignition hangs alarms on the tags, and the Alarm Notification module governs how, why and when people are told. For process alarms, the ISA-18 series covers the alarm lifecycle from identification and rationalization to change management. Rule of thumb: if the operator must act now, it belongs on the operator's screen; if an engineer should look tomorrow, a chart alert fits.
Where each runs. Grafana runs as a service on a supported operating system, in a container or on Kubernetes, and reaches its data sources over the network. Ignition sits as a gateway on site or in the cloud, near enough to read the PLCs, and serves screens to desktops, panels and phones.
Who builds it. Grafana panels are usually built in the browser by people who write the queries, often a data or IT team. Ignition projects are built in the Designer by controls engineers or an integrator who knows the PLC tags, with Python for scripts. Name an owner for each before go-live.
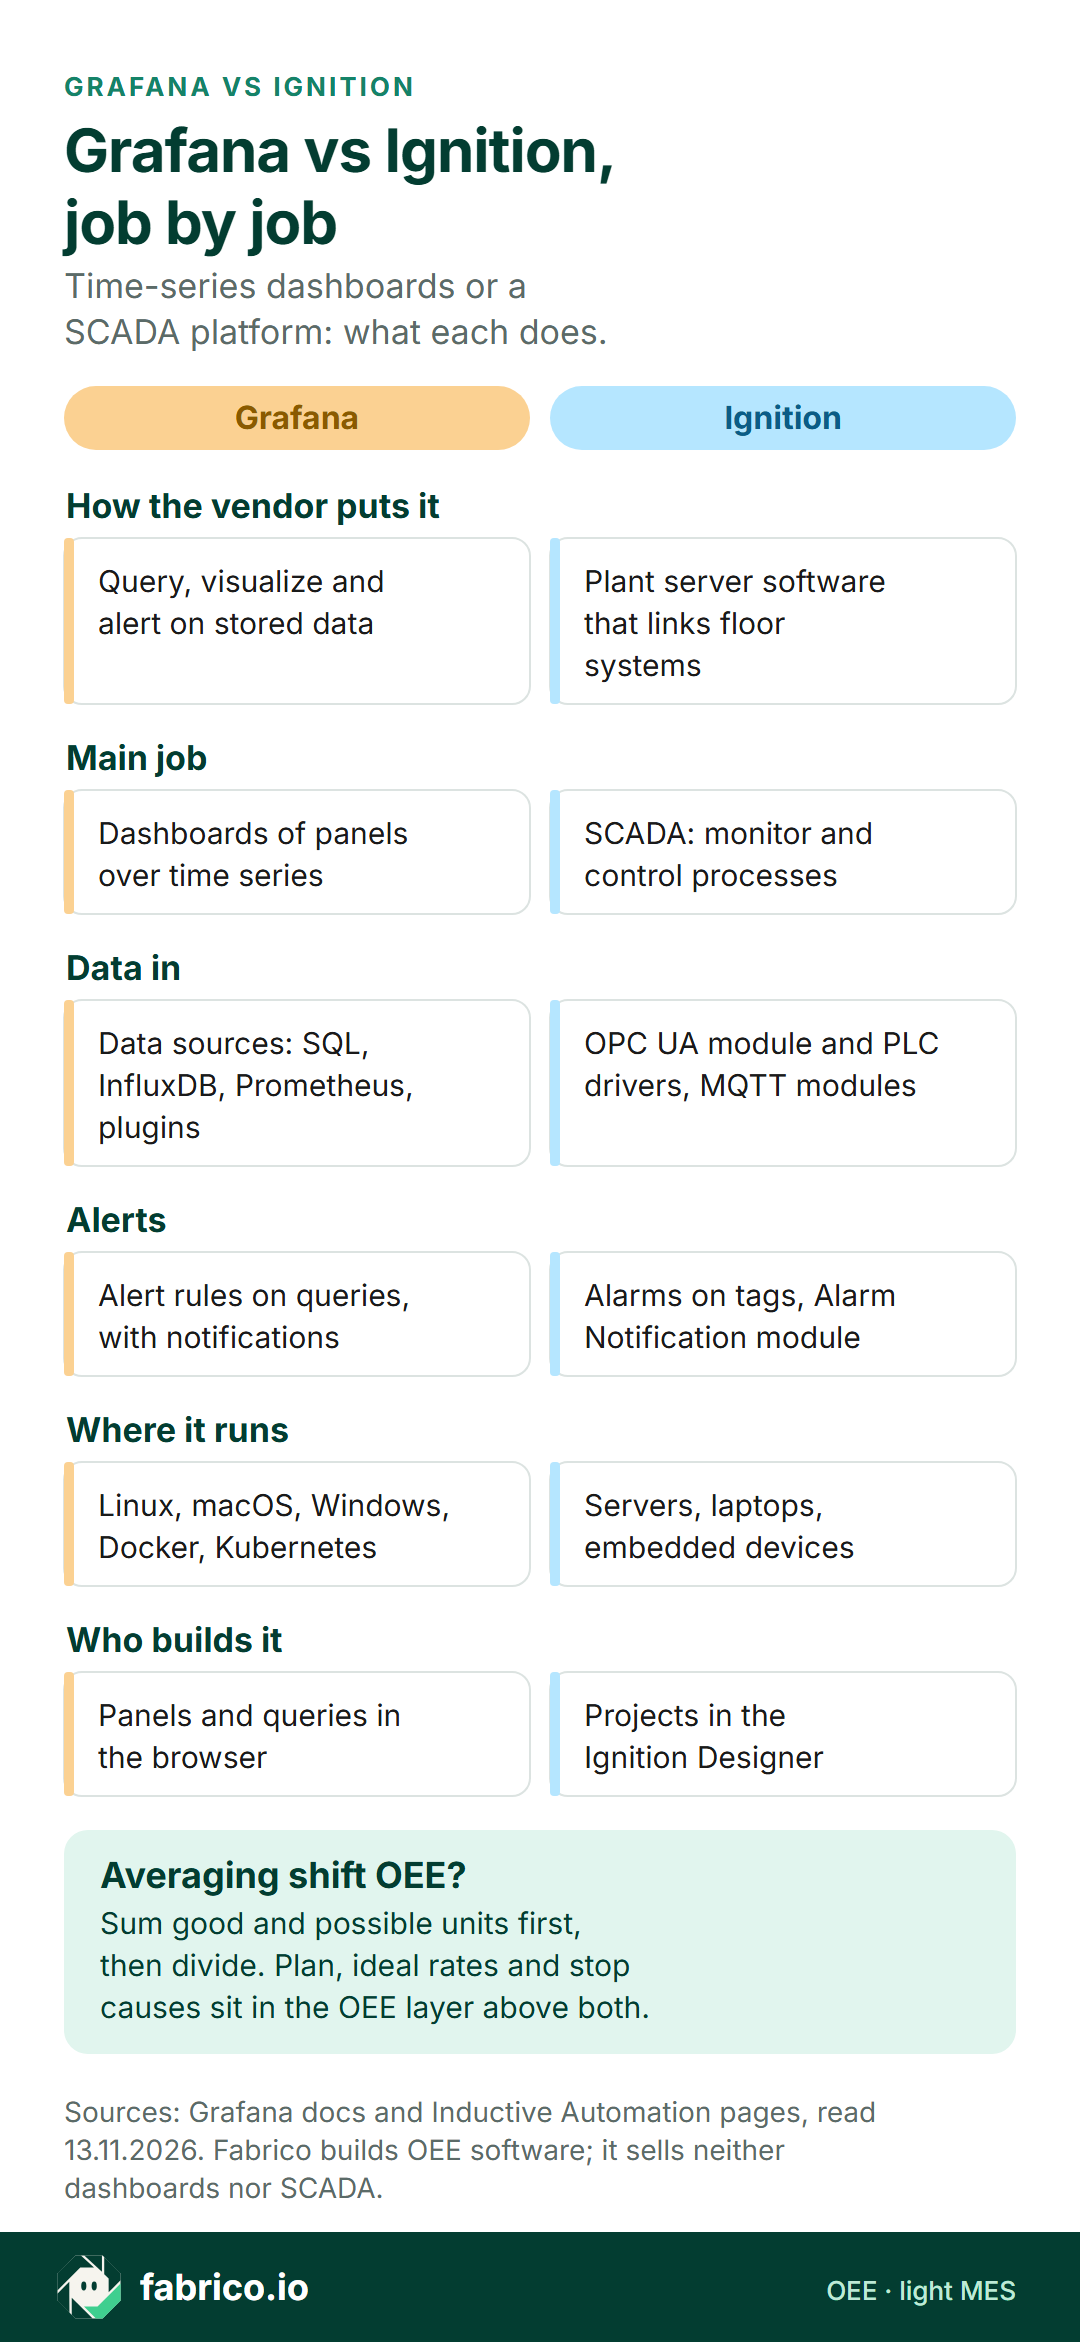
Text version of this infographic
- Grafana vs Ignition, job by job: time-series dashboards or a SCADA platform for plant data.
- How the vendor puts it. Grafana: Query, visualize and alert on stored data. Ignition: Plant server software that links floor systems.
- Main job. Grafana: Dashboards of panels over time series. Ignition: SCADA: monitor and control processes.
- Data in. Grafana: Data sources: SQL, InfluxDB, Prometheus, plugins. Ignition: OPC UA module and PLC drivers, MQTT modules.
- Alerts. Grafana: Alert rules on queries, with notifications. Ignition: Alarms on tags, Alarm Notification module.
- Where it runs. Grafana: Linux, macOS, Windows, Docker, Kubernetes. Ignition: Servers, laptops, embedded devices.
- Who builds it. Grafana: Panels and queries in the browser. Ignition: Projects in the Ignition Designer.
- Averaging shift OEE? Sum good and possible units first, then divide. Plan, ideal rates and stop causes sit in the OEE layer above both.
- Sources: Grafana docs and Inductive Automation pages, read 13.11.2026. Fabrico builds OEE software; it sells neither dashboards nor SCADA.
If the first job is a chart or a control screen
Pick the row closest to the job you need done first. A plant can land on more than one row.
| First job | Look at first |
|---|---|
| Live operator screens, setpoints and alarms on a line | Ignition, with Vision or Perspective |
| Trends over data already in SQL, InfluxDB or Prometheus | Grafana dashboards on that data source |
| Read a mix of PLC brands into one tag model and history | Ignition's OPC UA Module and Tag Historian |
| Plant charts next to the IT team's existing dashboards | Grafana reading the plant's history store |
| Operator screens on the floor, engineering trends upstairs | Both side by side, one history store |
| OEE by line and shift, with operator stop causes | OEE software such as a light MES, taking the line signals in |
If the open question is how PLC data reaches the server in the first place, our Ignition vs Kepware page compares a SCADA platform with a connectivity layer.
Where OEE and stop causes fit
OEE multiplies availability, performance and quality, each judged against planned production time and an ideal rate. A tag or counter can supply run state, counts and rejects, and either tool can show them. The plan for the shift, each product's ideal rate and the reason a line stopped come from planners and operators, so they need entry screens and rules of their own.
In an Ignition project, the line's state and counter live as tags and the Tag Historian logs them; an OEE module or an integrator-built screen does the sums, and reason entry is one more screen with a code list someone keeps tidy.
In Grafana, panels chart whatever OEE tables or raw counts the store holds. If stop reasons sit in a database table, annotations can pin them to a speed chart for the review meeting. The sums must be right before they reach the panel, as the example below shows. For layouts once the numbers are trusted, see our OEE dashboard examples.
Where Fabrico sits beside a chart wall and a SCADA gateway
Fabrico is none of the things compared here: no SCADA or HMI, no dashboard tool, no connectivity server. So it replaces neither Grafana nor Ignition. It is cloud OEE and light MES software, set out on the MES and OEE overview.
- Line data. A PLC, a sensor or a counter supplies running, stopped and counted. OPC UA and MQTT both appear in the protocol list on our machine connectivity page.
- Stop causes. The operator chooses a reason on a phone or tablet at the line. Fabrico turns that into OEE, downtime and losses per line and per shift, losses in money too, across web, iOS and Android apps.
- No signal? At a manual station the camera add-on counts output only, and stop reasons suggested by a camera sit on the Roadmap. Footage is streamed on request rather than stored.
- Data back out. OEE results leave by REST API or webhooks, or as Excel and CSV files, so they can be charted next to everything else.
Grafana keeps the chart wall and Ignition keeps the line screens; Fabrico would hold the plan, the reasons and the official OEE figure. For hand-fed steps beside automated ones, the computer vision for FMCG page shows where a camera counts.
Plans, reasons and OEE in one place: book a demo.
Worked example: a Mean panel vs time-weighted OEE
Every number in this section is sample data. Picture a PVC pipe extrusion line that cuts 6 metre lengths, with an ideal rate of 2 lengths a minute. On one day it runs two full shifts of 490 planned minutes each and a short night run of 175 planned minutes after a planned die change. A nightly SQL job writes one row per shift with the shift's OEE, and a Grafana Stat panel shows the day using the Mean calculation, which the calculation types page defines as "Mean value of all values in a field".
Early shift. 35 minutes of stops leave 455 run minutes, so availability is 455 / 490 = 92.86%. The ideal for 455 minutes is 910 lengths and the line makes 860, so performance is 94.51%. 27 are scrap, so quality is 833 / 860 = 96.86%. OEE is 92.86% x 94.51% x 96.86% = 85.0%, the same as 833 good out of 980 possible.
Late shift. 70 minutes of stops leave 420 run minutes: availability 85.71%. Ideal 840, made 770: performance 91.67%. 35 scrap: quality 735 / 770 = 95.45%. OEE is 75.0%, or 735 out of 980.
Night run. 60 minutes of start-up stops leave 115 run minutes: availability 65.71%. Ideal 230, made 160: performance 69.57%. 20 scrap during start-up: quality 140 / 160 = 87.50%. OEE is 40.0%, or 140 out of 350.
What the panel shows. (85.0% + 75.0% + 40.0%) / 3 = 66.7%.
What the day really was. Good output is 833 + 735 + 140 = 1,708 lengths. Possible output is 1,155 planned minutes x 2 = 2,310. OEE is 1,708 / 2,310 = 73.9%. The same figure comes from weighting each shift by its planned time: (85.0 x 490 + 75.0 x 490 + 40.0 x 175) / 1,155 = 73.9%. See OEE calculation for the formula itself.
The panel reads more than 7 points low because the 175 minute night run counts as much as each 490 minute shift. A short good run would push it high instead. The fix belongs in the query: return total good and total possible units for the period and divide, or reduce both fields with the Total calculation before any ratio is drawn. An Ignition screen that averages the same shift rows makes the same mistake, so agree one formula and let one system own it.
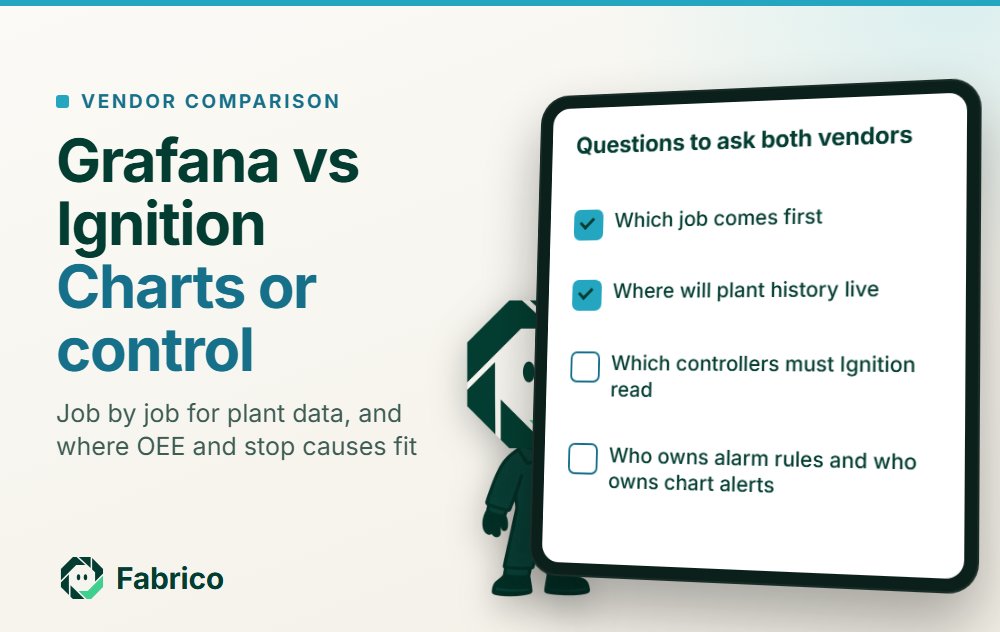
Questions to ask both vendors
- Which job comes first, live screens and alarms at the line, or trends over data already stored?
- Where will plant history live, and which Grafana data source or Ignition historian setting reads and writes it?
- Which controllers must Ignition read, and which of its drivers covers each?
- Who owns alarm rules and who owns chart alerts, so one event does not page two teams?
- How is OEE summed on every panel and screen: a ratio of totals, or an average of averages?
- Where do the shift plan, each product's ideal rate and the stop reasons live, and who may edit them?
What people ask next
Is Grafana a SCADA system?
Grafana Labs does not describe it that way. Its docs say Grafana lets you query, visualize, alert on and explore metrics, logs and traces wherever they are stored. Inductive Automation describes Ignition as SCADA software, used to monitor and control industrial processes.
Can Grafana and Ignition be used together?
Yes, as two layers. Ignition's Tag Historian keeps tag history in a SQL database, and Grafana ships core data sources for Microsoft SQL Server, MySQL and PostgreSQL. Ask your integrator how the history tables are laid out before you build panels on them.
Which one sends alerts to people?
Both, in different ways. Grafana alert rules run on queries, and the docs let you choose how, when and where notifications go, email or Slack among them. In Ignition, alarms are set on tags in the Tag Editor, and the Alarm Notification module decides how, why and when people are told.
Why does my Grafana OEE panel differ from the OEE report?
Often because the panel takes the Mean of per-shift or per-hour OEE values, which gives a short run the same weight as a long one. Sum good units and possible units first, then divide, and the panel matches the time-weighted figure.
Where should stop causes live if we run Grafana or Ignition?
In the system that owns the official OEE figure and lets an operator pick a reason at the line. That might be Ignition plus an OEE module, a custom Ignition screen, or OEE software such as Fabrico. Grafana can then chart those reason rows if they sit in a database it queries.
Want to see line signals, operator stop causes and OEE in one place? Book a demo.
Related articles

Latest from our blog


Real Fabrico tiles, sample data.