Login
 Blog
MES for Beverage Manufacturing: Syrup Room to Packaging Line

Key takeaways
- A beverage plant has two halves with different MES needs: the syrup room runs recipes, batches and cleaning, the packaging line runs speed.
- Full MES functions in beverage include recipe and batch management, lot tracking, quality checks, CIP records, scheduling and line performance.
- Start with production data and OEE on the filling line: the filler sets the pace, and its lost minutes are lost output.
- Charge starved and blocked time to the machine that caused it, not to the filler that waited.
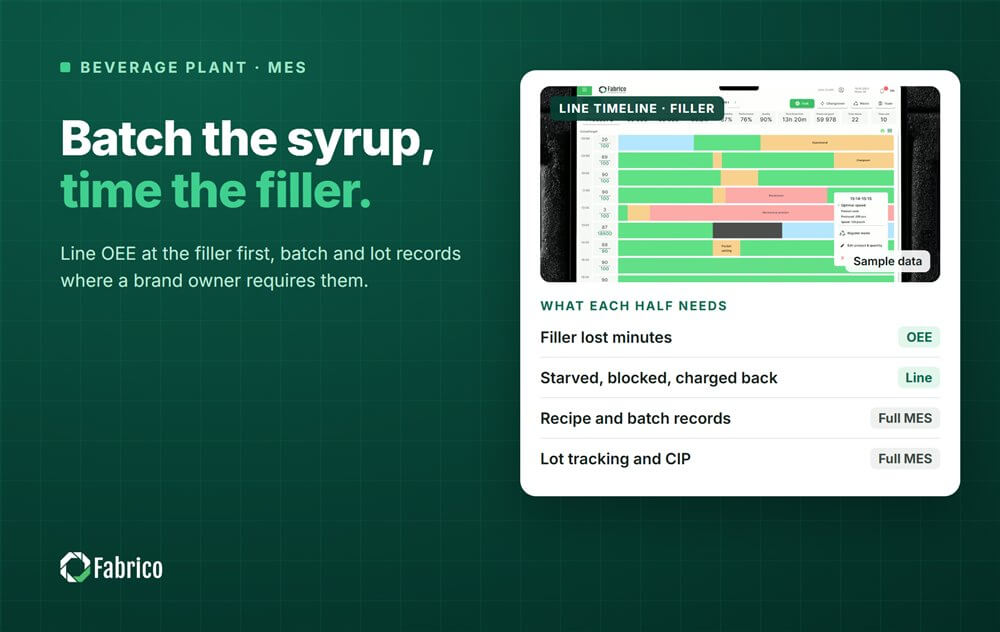
- Light MES puts line OEE and downtime first; a full MES adds batch and lot records where a brand owner or regulator requires them.
The can seamer on line 4 has stopped for the third time this hour, the lid feeder empty again. Upstream, the filler is blocked and the accumulation table in front of it is full. In the syrup room, the next flavour is still being blended after the flush. Three areas, one line not making cans, and three different stories in the shift log. Sorting those stories out is what an MES for beverage manufacturing is for.
This guide covers what a beverage plant needs from an MES, the functions on each side of the plant, which to start with, light MES against a full suite, how to choose and the mistakes that cost the most.
What a beverage plant needs from an MES
The syrup room, or process side, treats water, dissolves sugar, blends syrup to recipe and feeds the filler, often through a carbonation and blending skid. Its world is recipes, Brix and carbonation targets, tank batches, CIP cycles and ingredient lots.
The packaging side runs at speed: depalletiser, rinser, filler and capper or can seamer, fill level inspection, pasteuriser or warmer where the product needs it, labeller, coder, shrink packer or case packer, palletiser. On PET lines a blow moulder often feeds the filler directly. Its world is containers per minute, stops, format changes and rejects.
An MES for beverage has to serve both. The syrup room needs control and proof of what was blended. The packaging line needs to know, minute by minute, why the filler is not filling.

The MES functions, side by side
ISA-95 places the MES at Level 3, between the machine controls and the ERP. In a beverage plant its functions split like this:
| Function | Syrup room | Packaging line |
|---|---|---|
| Production data collection | Batch start and end, tank levels, transfers | Filler counts, machine states, stop times |
| Performance analysis | Batch cycle time, yield | Filler and line OEE by format and shift |
| Recipe management | Blend recipes, Brix and carbonation targets | Format settings per SKU |
| Batch records | Ingredients, quantities, test results | Fill lot, date code, line |
| Lot tracking and genealogy | Sugar and concentrate lots into syrup batches | Syrup batch into packed lots |
| Quality checks | Brix, carbonation, lab samples | Fill level, cap torque, seam checks |
| Cleaning records | CIP cycles, temperatures, concentrations | Filler CIP and flushes |
| Scheduling | Flavour order to cut flushes | Format order to cut change parts |
The syrup room column is where batch, lot and recipe functions live. The packaging column is where most of the lost output sits, and it needs fewer functions to start.
Where the time goes on a bottling or canning line
Lines are usually built on the V-curve: the filler is the slowest, costliest machine and sets the pace, and its neighbours run faster so accumulation can empty and refill around it, as Lineview explains. Only the filler runs at a steady speed; the rest stop and start. The usual stops:
- Depalletiser: layer falls, tier sheet not removed, empty containers tipped at the transfer.
- Conveyors and accumulation: fallen bottles, jams at combiners and guide rails.
- Filler: filling valve faults, foaming, product or CO2 supply, low and high fill rejects.
- Capper or seamer: cap chute empty, cap sorter jam, lid feeder empty, seamer jam, torque or seam rejects.
- Labeller and coder: glue problems, label magazine empty, splice on wrap-around labels, code missing.
- Shrink packer and palletiser: film splice, pack collation faults, pallet supply.
Changeovers come in three kinds: flavour (flush and sometimes a rinse), format (change parts on star wheels, guide rails and the capper) and label. Accumulation protects the filler for a while: by Little's law, a 1,500 bottle table in front of a 500 a minute filler is 3 minutes of protection. A downstream stop longer than that blocks the filler.
Start with production data and OEE on the filling line
OEE = Availability x Performance x Quality, measured at the filler because it sets the line's output.
- Availability: filler run time over planned production time. Decide once whether CIP and flavour changes are planned, and code them either way.
- Performance: the count against the filler's rated speed for that format. A 0.5 litre and a 1.5 litre bottle have different rates; one rate for all formats hides the real loss.
- Quality: good containers over total. Count fill level rejects, cap and seam rejects, label rejects and product lost at start-up.
- Starved and blocked: when the filler waits, charge the minutes to the root-cause machine. See starvation and blocking.
The data comes from the filler PLC (state and count), the inspection systems (rejects), states from the upstream and downstream machines, a camera over the conveyors where fallen bottles cause stops the PLC reports only as "stopped", and the operator, who confirms the reason. Where machines expose PackML tags, those tags were designed to address OEE, which makes the connection easier.
What the filler's lost minutes cost
Sample line (illustrative numbers, not a customer): a canning line whose filler is rated, for this format, at 500 cans a minute. The shift is 480 minutes with 40 minutes of planned CIP and flush, so planned production time is 440 minutes. Unplanned stops add up to 44 minutes, so run time is 396 minutes.
- Availability = 396 / 440 = 90.0%.
- Ideal count = 396 x 500 = 198,000 cans. The line made 178,200. Performance = 178,200 / 198,000 = 90.0%.
- Rejects were 1,782, so good count is 176,418. Quality = 176,418 / 178,200 = 99.0%.
- OEE = 0.900 x 0.900 x 0.990 = 80.2%. Check: 176,418 / 500 = 352.8 minutes of ideal time, and 352.8 / 440 = 80.2%.
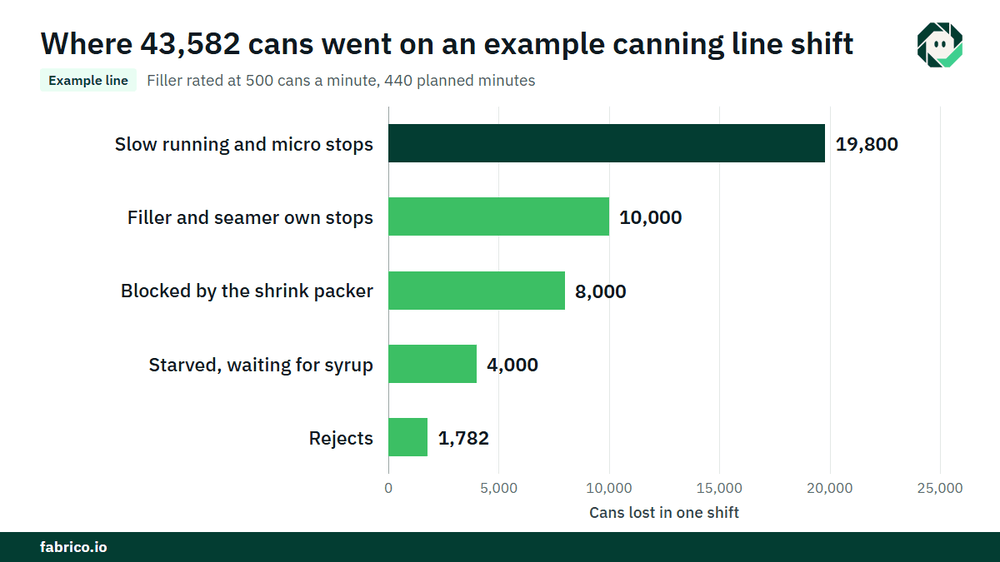
The filler could have made 220,000 cans in 440 minutes. It made 176,418 good ones, so 43,582 were lost. At a contribution of $0.10 a can (€0.10 in a euro plant), that is $4,358.20 a shift. The 44 stop minutes split by root cause:
| Root cause of filler stops | Minutes | Cans lost | Value |
|---|---|---|---|
| Filler and seamer own stops | 20 | 10,000 | $1,000 |
| Blocked by the shrink packer | 16 | 8,000 | $800 |
| Starved, waiting for syrup after a flavour change | 8 | 4,000 | $400 |
| Total stops | 44 | 22,000 | $2,200 |
The other $2,158.20 is slow running and micro stops (19,800 cans, $1,980) and rejects (1,782 cans, $178.20). Over 500 shifts a year, $4,358.20 a shift is $2,179,100, or €2,179,100 in a euro plant. The table shows that 24 of the 44 minutes were not the filler's fault at all.
Light MES vs full MES for a beverage plant
A light MES is the same Level 3 layer in a different order: OEE and downtime on the filling line first, on one line, then more lines and functions as they are needed. A full MES suite covers recipes, batch records, lot genealogy, quality, cleaning records and scheduling across both halves of the plant, with deeper ERP integration and a longer project.
In many beverage plants the syrup room already has batch control in its process system. The packaging hall is often where data is thinnest: a paper log, a filler counter and a shift report. That makes the filling line the natural first step for a light MES.
A full MES earns its place where a brand owner, a co-packing contract or a regulator expects electronic batch and lot records from syrup to pallet. Many plants end up with both: batch and lot functions where they are required, line OEE on every filling line.
How to choose an MES for a beverage plant
- Ask for line OEE and filler OEE from the same data, with starved and blocked charged to the root-cause machine.
- Check rated speed per format, not one nameplate speed for the line.
- Ask how it reads each machine: PLC states, PackML tags where they exist, sensors or a camera where they do not.
- Leave the syrup room's batch control alone unless replacing it is the goal.
- Keep the ERP interface small: orders in, actuals out.
- Agree the start: one filling line, a baseline from today's log and a decision date agreed in advance.
Mistakes beverage plants make with MES
- Measuring the filler only and calling it line OEE, so the packer's stops disappear into "blocked".
- Blaming the waiting machine instead of the root-cause machine.
- Setting V-curve speeds once and never again, while formats change. See finding the real constraint on linked lines.
- Ignoring slow running. A filler held below rated speed never shows a stop. See rate loss on high-speed lines.
- Shortening a CIP or flush to win OEE points. That is a product safety risk, not an improvement.
Where Fabrico fits
Fabrico is a computer vision enabled Manufacturing Performance Platform. In a beverage plant it is a light MES with OEE and downtime first, starting on one filling line.
- Automatic downtime logging from the filler, seamer and other machine signals.
- The operator confirms the reason in one tap.
- A camera clip as evidence for a stop, where a camera watches the conveyor or the station.
- Losses priced in money and ranked by money.
- OEE live by line and shift, and one view across plants.
- As the last step, a stop coded as a breakdown becomes a work order to the right technician, with its cost.
In MESA terms that is data collection, performance analysis and, as the last hop, maintenance management. Machines connect through a PLC, a Fabrico IoT device or an AI camera. Fabrico is not an ERP and not a full MES suite: it does not do recipe management, scheduling, batch records, genealogy or traceability, and it does not replace the syrup room's batch control.
Two named results: ABB, 20% less downtime; Ficosota, OEE from 53% to 60% and 23% more good output. Each plant gets a quote after a review of its lines. For the wider picture, read our guide to MES software.
Frequently asked questions
What does an MES do in a beverage plant?
It runs and records production between the machines and the ERP. In the syrup room that means recipes, batches, cleaning records and ingredient lots; on the packaging line, counts, stops, format changes and OEE.
Should OEE be measured on the filler or the whole line?
Both, from the same data. The filler sets the line's output, so line OEE is measured there, and each other machine's stops show as starved or blocked time charged to the root cause.
What ideal speed should a bottling line use for OEE?
The filler's rated speed for each format, agreed and written down. Using a lower, comfortable speed hides speed loss; using one nameplate speed for all formats makes some formats look broken.
Do beverage plants need a full MES?
Only where electronic batch and lot records from syrup to pallet are required. Where lost output is the main cost, start with OEE and downtime on one filling line.
See your filling line's losses in a demo
Bring one bottling or canning line and its current downtime log. We will show where the filler's time goes and what each loss costs.