


 Login
 Blog
North America Factory Output Tracker: US, Canada and Mexico, Month by Month

In short: North American factory output is moving in three directions. US industrial production rose 0.7% in September 2026, with manufacturing up 0.3% (Federal Reserve). Canadian manufacturing sales were flat at C$80.2 billion while volume fell 1.5% and unfilled orders hit a record C$136.8 billion (Statistics Canada). Mexico's industrial activity fell 1.4%, manufacturing 1.7% (INEGI).
- US factories used 75.9% of their capacity in September, below the long-run average of 78.2%, yet the ISM production index was 59.0 in October and factory overtime averaged 3.1 hours a week.
- A full order book and slack capacity can sit in the same plant. The slack is usually inside the shifts: changeovers, short stops and slow running.
- Example plant: a 10% backlog on a thermoforming line. Recovering 8 hours a week inside current shifts instead of running a Saturday shift saves USD 78,000 to USD 103,792 a year at BLS labour costs.
Updated: 16 November 2026. Next update: December 2026.
This tracker follows factory output in the United States, Canada and Mexico from the official monthly releases, newest first, and adds each new month at the top. For each release it gives the numbers, then what a plant or production manager can take from them for scheduling, staffing and overtime. The figures that matter most here are capacity figures, because the question behind most searches for factory output is whether plants have room to make more. National capacity utilization answers that for an economy; for one line, the answer sits in its run hours, stops and counts.
Which official series this page reads
Five releases cover the three countries. Each is read on its publisher's page on the day this tracker is updated, and each reading carries its date, because these series are revised: the Federal Reserve publishes its annual revision of the industrial production indexes on 24 November 2026, with 2022 as the new base year.
| Country | Release | Publisher | What it gives a plant | Timing |
|---|---|---|---|---|
| United States | G.17 Industrial Production and Capacity Utilization | Federal Reserve Board | Output volume and the share of capacity in use, by industry | Mid-month, for the month before |
| United States | The Employment Situation | Bureau of Labor Statistics | Factory jobs, weekly hours and overtime hours | First Friday, for the month before |
| United States | Manufacturing PMI | Institute for Supply Management | Purchasing managers' survey: orders, production, backlog, prices | First business day, for the month before |
| Canada | Monthly Survey of Manufacturing | Statistics Canada | Sales in dollars and volume, unfilled orders, inventories, capacity utilization | About six weeks after the month |
| Mexico | Indicador Mensual de la Actividad Industrial | INEGI | Industrial activity by sector and manufacturing subsector | About six weeks after the month |
The ISM index is a survey: a reading above 50 means more purchasing managers reported growth than decline. It is not a volume measure, and it can disagree with the Federal Reserve's output index for months at a time. That disagreement is useful, as the section on busy markets and slack plants shows.
Scoreboard: the newest reading for each country
| Measure | Latest | Month | Year on year | Published | Next |
|---|---|---|---|---|---|
| US industrial production | +0.7% | September 2026 | +2.2% | 16 Oct 2026 | 17 Nov 2026 |
| US manufacturing output | +0.3% | September 2026 | +1.1% | 16 Oct 2026 | 17 Nov 2026 |
| US manufacturing capacity utilization | 75.9% | September 2026 | long-run average 78.2% | 16 Oct 2026 | 17 Nov 2026 |
| US factory jobs | +19,000 | October 2026 | not used here | 6 Nov 2026 | December 2026 |
| ISM manufacturing PMI | 55.5 | October 2026 | survey index | 2 Nov 2026 | December 2026 |
| Canada manufacturing sales | 0.0% (volume -1.5%) | September 2026 | +10.9% (dollars) | 13 Nov 2026 | December 2026 |
| Canada capacity utilization | 81.5% | September 2026 | not seasonally adjusted | 13 Nov 2026 | December 2026 |
| Mexico industrial activity | -1.4% | September 2026 | +1.4% | 11 Nov 2026 | 11 Dec 2026 |
| Mexico manufacturing | -1.7% | September 2026 | +0.5% | 11 Nov 2026 | 11 Dec 2026 |
Month-on-month changes are seasonally adjusted. Canada's year-on-year figure is in current dollars, so it includes price changes; the 1.5% monthly fall in constant dollars is the volume signal. The Federal Reserve's October figures are due on 17 November 2026 and will appear here in the December update.
13 November 2026: Canada's sales flat, unfilled orders a record C$136.8 billion
Statistics Canada reported that manufacturing sales were essentially unchanged in September at C$80.2 billion, after a 1.8% rise in August. In constant dollars, sales fell 1.5%, the largest drop since January 2026. Unfilled orders rose to a record C$136.8 billion. Inventories rose 1.7% to C$130.5 billion, and the inventory-to-sales ratio rose from 1.60 to 1.63. Sales fell in 11 of 21 subsectors. Capacity utilization, not seasonally adjusted, edged down from 81.6% to 81.5%; transportation equipment rose 4.0 points while petroleum and coal fell 8.0 and primary metal 1.7.
What a plant manager takes from it. A record order book with falling volume means Canadian plants, taken together, have work they did not ship. Inventories rising at the same time means part of the output is sitting as stock. For one plant in that position, the order of questions matters: first, which line is the constraint for the late orders; second, how much of that line's planned time was lost to stops and changeovers last month; only then, whether to add hours. A transportation equipment supplier, whose sector added 4.0 points of utilization in a month, should run that check before the next customer schedule arrives.
11 November 2026: Mexico's industrial activity down 1.4% in September
INEGI's monthly industrial activity indicator fell 1.4% in September from August, seasonally adjusted, and was 1.4% higher than a year earlier. Manufacturing fell 1.7% on the month and was 0.5% higher on the year. In the original, unadjusted series, food manufacturing was 1.5% lower than in September 2025, plastics and rubber 0.5% lower, and machinery and equipment 7.3% higher. INEGI's next release is due on 11 December 2026.
What a plant manager takes from it. In Mexico the signal for food and packaging plants is softer volume: food down 1.5% on the year, plastics and rubber down 0.5%. When orders shrink, customers often order the same range in smaller lots, and a line makes the same products with more changeovers. A Mexican food plant should count its changeovers per shift for September against September 2025. If the count rose while volume fell, the lost hours are in changeovers, and that is where to work, as our guide to changeover time sets out.
6 November 2026: US factories add 19,000 jobs in October, overtime at 3.1 hours
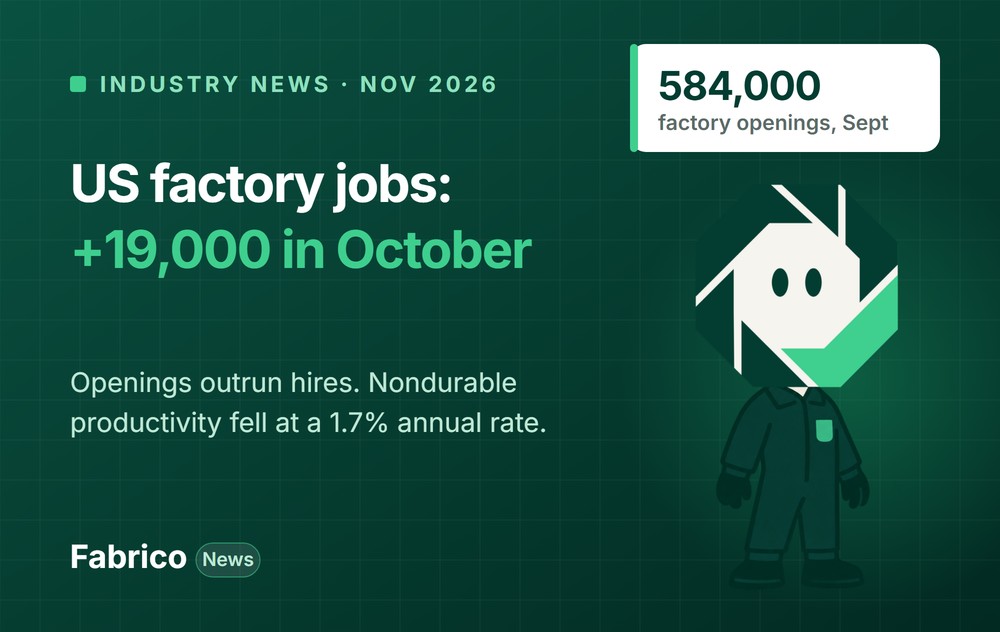
The Bureau of Labor Statistics reported that manufacturing employment continued to trend up in October, by 19,000. The average factory workweek held at 40.5 hours, and overtime rose to 3.1 hours a week. Economy-wide, private average hourly earnings were US$38.00 for all employees. Our note on US factory jobs and productivity in October covers the release in more detail.
What a plant manager takes from it. Plants are adding people and still running 3.1 hours of overtime a week per worker on average. Overtime is the fastest way to add output, and the most expensive per unit, because the premium is paid on hours the line could have produced inside the normal week. Before signing another Saturday, check the line's own record for the last four weeks: how many hours did it lose to stops and changeovers inside the 40? If that number is larger than the overtime, the first hours to buy back are those.
2 November 2026: ISM manufacturing PMI 55.5 in October, production at 59.0
The Institute for Supply Management reported a manufacturing PMI of 55.5 for October, up from 54.5. New orders stood at 55.5, production at 59.0 (from 56.7), employment at 52.4, and the backlog of orders at 54.6, down from 56.4. Prices paid were 75.2. Plastics and rubber products was the top-ranked of the 12 industries reporting growth, with new orders, production, employment and backlogs all rising. Food, beverage and tobacco products expanded overall, but its production and new orders declined while its backlogs grew and its suppliers delivered more slowly.
What a plant manager takes from it. For a plastics converter, October was a month of more orders and longer backlogs. For a food plant, it was a month of slower supplier deliveries and a growing backlog with falling production: a pattern that points at material waits and short runs, not at line speed. With prices paid at 75.2, more purchasing managers paid higher prices in October than in September, so a scrap point is likely worth more now than in the last budget.
16 October 2026: US industrial production up 0.7% in September, factories at 75.9% of capacity
The Federal Reserve's G.17 release put total industrial production up 0.7% in September, after a smaller rise in August, and 2.2% above September 2025. Manufacturing output rose 0.3% on the month and 1.1% on the year; motor vehicles and parts fell 3.0%. Capacity utilization was 76.9% for total industry, against a 1972 to 2025 average of 79.4%, and 75.9% for manufacturing, against an average of 78.2%. The release calendar lists the October figures for 17 November and November's for 16 December 2026.
What a plant manager takes from it. Nationally, US factories have room: almost a quarter of measured capacity was idle in September. That does not mean any one plant has room. The national rate counts capacity a plant has but does not schedule, and it averages busy sectors with quiet ones. A plant with a backlog and a line at 55% OEE has room of a different kind: the hours are scheduled and paid for, and part of them make nothing.
Busy market, slack plant: why both can be true
Put the October and September figures side by side and they seem to disagree. ISM production at 59.0 and a record Canadian backlog say plants are busy. US manufacturing capacity utilization at 75.9% says they are not. Both are right, because they measure different layers of capacity.
- National capacity utilization compares output with what the industry could produce if it ran its installed equipment on a realistic schedule. It includes lines that are mothballed, shifts that are not staffed and plants that are short of orders.
- A purchasing manager's survey reports direction: more orders, more production, longer backlogs than last month. It says nothing about how much of each line's time turned into good output.
- OEE measures the scheduled time of one line: how much of it ran, at what speed, with how much scrap. It is the only one of the three a plant can act on this week.
A plant can therefore sit in a busy sector, have a backlog, pay overtime and still have a line that makes good parts for little more than half of its planned hours. The two trade bodies cited above see both sides of that: ISM reports backlogs growing in plastics and food, and the National Association of Manufacturers' third-quarter outlook survey, run from 11 to 27 August 2026, found 78.9% of manufacturers optimistic, up from 74.2%, with raw material costs ranked as the top challenge and input costs expected to rise 5.0% over the next year. More orders at higher material cost is the situation in which lost line hours cost the most.
Three checks for your line this month
1. Compare lost hours with overtime hours
Add up, for the constraint line, the hours lost to stops and changeovers in the last four weeks. Set them beside the overtime hours paid on the same line. If the lost hours are larger, the line is buying back with overtime the time it gave away in the week. The comparison is worked through in overtime vs OEE, and the same logic before a capital request is in hidden capacity before buying a production line.
2. Separate utilization from loading
A line can be fully loaded, with every shift scheduled, and still poorly utilized, with long stops inside those shifts. Or it can run well when it runs and simply not be scheduled enough. National figures blend the two. Your own figures should not: track scheduled hours against calendar hours, and OEE inside the scheduled hours, as two numbers. Machine utilization vs loading explains the difference.
3. Count changeovers when orders get smaller
Mexico's food output fell 1.5% on the year in September and ISM reported falling production in US food plants while backlogs grew. Both are conditions in which orders come in smaller lots. Count changeovers per shift this month against the same month last year. More changeovers on less volume is a loss you can see only if each changeover is a timed event in the line record. OEE software logs those events as they happen, and a light MES links them to the order that caused them.
Worked example: a backlog, a Saturday shift, or 8 recovered hours
Example plant. Every figure here is example data except the labour cost values and the overtime rule, which are sourced. The plant is not a company named on this page.
A US plastics plant runs one thermoforming line on two 8-hour shifts, five days a week: 80 planned hours. The ideal rate is 3,000 parts an hour, and the line runs at 55% OEE, so it makes 1,650 good parts per planned hour, or 132,000 a week. Orders have grown, as ISM reported for plastics and rubber in October, and the plant needs 145,200 parts a week, 10% more. Each shift has a crew of four.
What an overtime hour costs, from BLS
The BLS employer costs for employee compensation for June 2026 put manufacturing at US$32.50 an hour in wages and salaries and US$48.62 an hour in total compensation, of which US$16.12 is benefits. Under the Fair Labor Standards Act, the Department of Labor requires overtime for covered, non-exempt employees after 40 hours a week at no less than one and a half times the regular rate. That gives a range per overtime hour:
- Low: wages only, at time and a half: 1.5 x US$32.50 = US$48.75.
- High: full compensation plus the half-time premium on wages: US$48.62 + 0.5 x US$32.50 = US$64.87. This assumes the benefit cost of an hour also applies to an overtime hour, which is our assumption.
Option A: a Saturday shift (the usual answer)
One 8-hour Saturday shift at the same 55% OEE makes 8 x 1,650 = 13,200 parts, exactly the gap. Four people for 8 hours is 32 overtime hours a week: 32 x US$48.75 = US$1,560 a week at the low end and 32 x US$64.87 = US$2,075.84 a week at the high end. Over 50 working weeks that is US$78,000 to US$103,792 a year. It is a realistic baseline, not a strawman: the BLS average of 3.1 overtime hours a week in manufacturing shows it is a routine choice.
Option B: recover 8 hours inside the week
The same 13,200 parts are 13,200 / 1,650 = 8 hours of output at the line's current rate. The line's own records, in this example, show 10 changeovers a week averaging 50 minutes and about 7 hours of short stops. Cutting changeovers to 30 minutes returns 10 x 20 = 200 minutes. Removing 280 minutes of the short stops returns the rest: 200 + 280 = 480 minutes, 8 hours. Weekly output becomes 132,000 + 13,200 = 145,200 parts, and OEE rises from 55% to 145,200 / (80 x 3,000) = 60.5%.
| Example data, per week | Today | A: Saturday shift | B: recover inside shifts |
|---|---|---|---|
| Planned line hours | 80 | 88 | 80 |
| OEE | 55.0% | 55.0% | 60.5% |
| Good parts | 132,000 | 145,200 | 145,200 |
| Overtime cost | US$0 | US$1,560 to 2,075.84 | US$0 |
| Overtime cost a year (50 weeks) | US$0 | US$78,000 to 103,792 | US$0 |
Against the realistic baseline, Option B saves US$78,000 to US$103,792 a year on one line. The sums leave out what the recovery work costs: engineering and operator time on changeover methods and short-stop causes, and the weeks it takes before the gain holds. In those weeks the plant will probably run Saturdays anyway. They also leave out energy and wear for the Saturday shift, which would make Option A dearer, and they assume the recovered time runs at the same speed and scrap rate as the rest of the week. If it does not, measure the real gain before cancelling the overtime.
Book a demo and see downtime and changeovers per line and shift.
Questions to ask before you add a shift
When the backlog grows, there are four ways to add output. Each fits a different plant.
| Option | Cost range | Choose it if | Ask first |
|---|---|---|---|
| Overtime on the constraint line | US$48.75 to 64.87 per person-hour (BLS and DOL basis above) | The gap is short-lived and the line already runs close to its best weeks | How many hours did this line lose inside the week last month? |
| A permanent extra shift | A full crew at straight time, plus supervision and hiring | The backlog is structural and the line is near its best OEE | Can we hire and train a full crew before the backlog clears? |
| Recover hours inside current shifts | Engineering and operator time; little capital | Changeovers and short stops take more hours than the overtime | Are stops and changeovers timed events in the line record? |
| A new line or machine | Capital, installation and ramp-up | The line is at its best OEE across all scheduled hours and demand is lasting | Have we measured the hidden capacity first? |
A monthly routine for plant, production and CI managers
This week
- Plant manager: name the constraint line for your late orders and get its last four weeks of planned hours, lost hours and overtime hours on one sheet.
- Production manager: count changeovers per shift on that line for this month and the same month last year.
- CI manager: rank the line's stop causes by hours lost and pick the top one for a two-week fix.
This quarter
- Read the releases on a fixed day: ISM on the first business day, BLS on the first Friday, the Federal Reserve mid-month, INEGI and Statistics Canada about six weeks after the month. Note one line per release: sector move, your move, the gap.
- Set an overtime rule: no recurring Saturday on a line whose stop and changeover hours last month exceeded the overtime requested.
- Price an hour of each line with your own wage and benefit rates, and refresh it when input costs move.
- Report loading and OEE separately for every line, so a scheduling gap and a performance gap never share one number.
How Fabrico fits
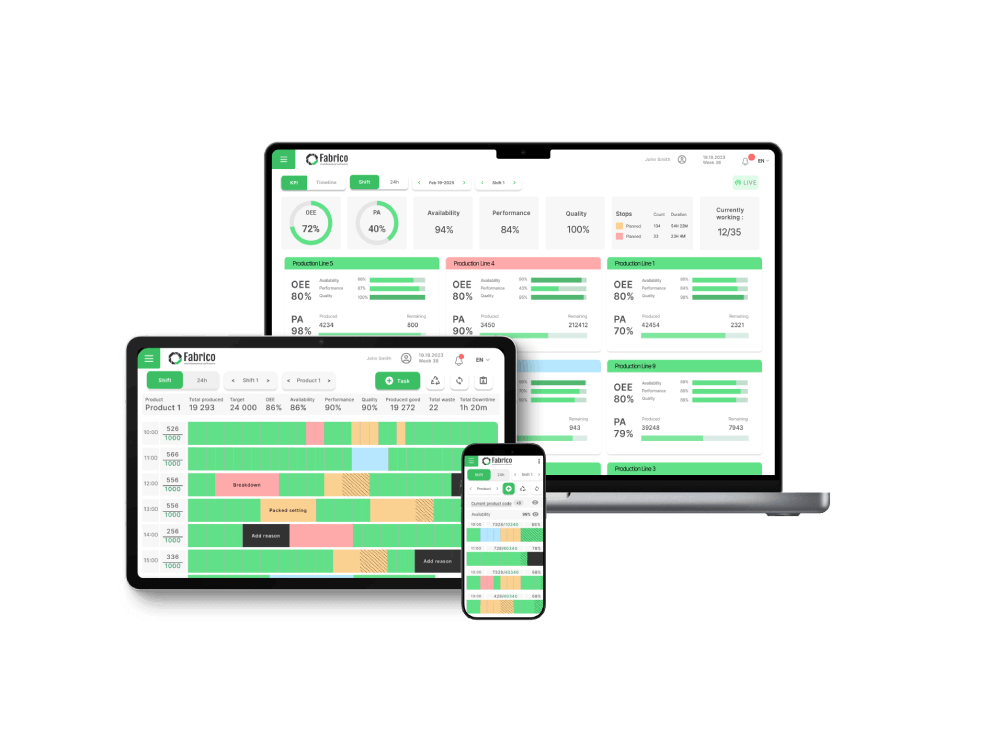
Fabrico is a cloud OEE and light MES platform. It records OEE and losses by machine, line and shift, from the PLC or a Fabrico IoT device, with reasons operators add on a tablet or phone. That is the plant-side record this page asks for: planned hours, lost hours, changeovers and good counts per line.
On manual stations, AI cameras (an add-on) count output.
Updated: 16 November 2026. Next update: December 2026, with October data from the Federal Reserve, Statistics Canada and INEGI and November data from BLS and ISM.
What people ask next
What is the latest US industrial production figure?
The Federal Reserve's G.17 release of 16 October 2026 put September industrial production up 0.7% on August and 2.2% on the year, with manufacturing up 0.3%. October figures are scheduled for 17 November 2026, and an annual revision with a 2022 base year for 24 November 2026.
How often does Statistics Canada publish manufacturing sales?
Monthly, in the Monthly Survey of Manufacturing, about six weeks after the month. The September 2026 release of 13 November showed sales flat at C$80.2 billion, volume down 1.5% and unfilled orders at a record C$136.8 billion.
What does Mexico's industrial activity indicator measure?
INEGI's monthly indicator (IMAI) covers mining, utilities, construction and manufacturing, seasonally adjusted, with subsector detail in the original series. In September 2026 it fell 1.4% on the month; manufacturing fell 1.7%. The next release is due on 11 December 2026.
Why is US capacity utilization low when the ISM index shows growth?
They measure different things. Capacity utilization compares output with what installed capacity could produce: 75.9% in manufacturing in September 2026. The ISM PMI is a survey of direction: 55.5 in October means more managers reported growth than decline. A sector can grow from a level that still leaves capacity idle.
Should a plant with a backlog add overtime or improve OEE first?
Compare the hours the constraint line lost to stops and changeovers in the last four weeks with the overtime you plan. If the lost hours are larger, recover them first. In this page's example, recovering 8 hours a week instead of a Saturday shift saves US$78,000 to US$103,792 a year.
How much does an overtime hour cost a US manufacturer?
On BLS June 2026 data, manufacturing wages average US$32.50 an hour and total compensation US$48.62. At time and a half under the FLSA, an overtime hour costs about US$48.75 in wages alone, or about US$64.87 if the benefit cost of an hour also applies.
Sources
Sources accessed on 16 November 2026 unless marked as accessed on another date. Dates are the publication dates shown on each page.
- Federal Reserve Board, G.17 Industrial Production and Capacity Utilization, September 2026, 16 October 2026, accessed 16 November 2026
- Federal Reserve Board, G.17 release dates, 2026 schedule, accessed 16 November 2026
- Statistics Canada, The Daily: Monthly Survey of Manufacturing, September 2026, 13 November 2026, accessed 16 November 2026
- INEGI, Indicador Mensual de la Actividad Industrial, septiembre de 2026 (press release, PDF), 11 November 2026, accessed 16 November 2026
- US Bureau of Labor Statistics, The Employment Situation, October 2026, 6 November 2026, accessed 16 November 2026
- US Bureau of Labor Statistics, Employer Costs for Employee Compensation, Table 4 (June 2026), 9 September 2026, accessed 16 November 2026
- Institute for Supply Management, Manufacturing PMI at 55.5%, October 2026 ISM Manufacturing PMI Report (via PR Newswire), 2 November 2026, accessed 16 November 2026
- National Association of Manufacturers, 2026 Third Quarter Manufacturers' Outlook Survey, undated page (fieldwork 11 to 27 August 2026), accessed 16 November 2026
- US Department of Labor, Wage and Hour Division, Overtime Pay, undated, accessed 16 November 2026
Related articles




Latest from our blog





Real Fabrico tiles, sample data.