


 Login
 Blog
US Factory Jobs Up 19,000 in October, Nondurable Productivity Down 1.7% in Q3

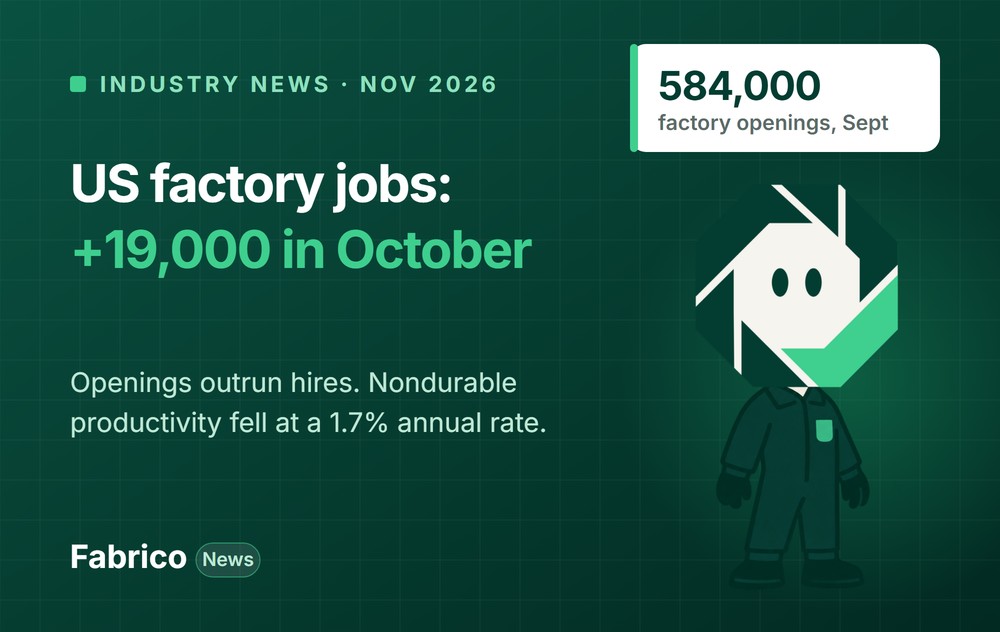
In short: US factories added 19,000 jobs in October 2026, and factory overtime rose to 3.1 hours a week. In September there were 584,000 open factory jobs but only 313,000 hires. In the third quarter, productivity in nondurable manufacturing, the group that includes food and drink, fell at a 1.7% annual rate.
- Plants are hiring, but openings far outrun hires, so much of any output gain has to come from the crews and lines already in place.
- In nondurables, output fell while hours worked rose slightly. That means less output for each hour worked.
- Below: what the US Bureau of Labor Statistics reported, the labor turnover numbers, what it means for plant, production and maintenance managers, three steps for this month and a checklist for the quarter.
News, 13 November 2026. Every news figure below comes from a linked source, and the full list is at the end.
What the US data showed in early November 2026
Three releases from the US Bureau of Labor Statistics (BLS) came out within four days.
Jobs, October. The employment report of 6 November showed manufacturing jobs up 19,000 in October, and up 101,000 since a recent low in December 2025. The gain came from durable goods, up 25,000, while nondurable goods fell 6,000. In manufacturing, the average workweek held at 40.5 hours and overtime rose 0.1 hour to 3.1 hours.
Openings, September. The job openings report of 3 November put manufacturing openings at 584,000 in September, a rate of 4.4%, up from 530,000 in August and 389,000 a year earlier. Manufacturing hires in September were 313,000.
Productivity, third quarter. The productivity release of 5 November showed manufacturing labor productivity up 0.3%, as output rose 1.3% and hours worked rose 1.0%. The two halves went in opposite directions:
- Durable manufacturing: productivity up 2.2%, output up 3.8%, hours up 1.6%.
- Nondurable manufacturing: productivity down 1.7%, output down 1.6%, hours up 0.1%.
Unit labor costs in manufacturing rose 2.7% in the quarter and 4.0% from a year earlier. All quarterly changes are seasonally adjusted annual rates. All the figures above are preliminary and subject to revision; BLS publishes revised third-quarter productivity on 8 December 2026.
The numbers behind the news: who is joining and who is leaving
The job openings report also counts hires, quits and layoffs in manufacturing. Figures in thousands, seasonally adjusted, from the BLS job openings and labor turnover release of 3 November 2026; rates in brackets are percent.
| Manufacturing | Sept 2025 | Aug 2026 | Sept 2026 |
|---|---|---|---|
| Job openings | 389 (3.0) | 530 (4.0) | 584 (4.4) |
| Hires | 300 (2.4) | 347 (2.7) | 313 (2.5) |
| Total separations | 308 (2.4) | 324 (2.6) | 318 (2.5) |
| Quits | 177 (1.4) | 205 (1.6) | 199 (1.6) |
| Layoffs and discharges | 111 (0.9) | 101 (0.8) | 99 (0.8) |
| Openings, durable goods | 248 (3.1) | 375 (4.5) | 403 (4.9) |
| Openings, nondurable goods | 141 (2.9) | 156 (3.2) | 180 (3.7) |
| Quits, nondurable goods | 79 (1.6) | 99 (2.1) | 91 (1.9) |
On our arithmetic, there were about 1.9 openings for every hire in September 2026, against about 1.3 a year earlier. Quits, people choosing to leave, were 199,000 of the 318,000 separations, nearly two in three, while layoffs were under a third. In nondurable goods, the quit rate of 1.9% was higher than durable goods' 1.4%.
For a plant, the quit figure matters as much as the openings. Each trained operator who leaves takes line capacity with them until a replacement reaches full rate. The release does not say why people leave or how long it takes to replace them, and we do not guess.
Background: labor costs are rising faster than productivity
The productivity release puts the two together. Manufacturing unit labor costs, the labor cost of making one unit, rose 2.7% at an annual rate in the third quarter and 4.0% on a year earlier, while productivity rose 0.3%. When cost per hour rises faster than output per hour, cost per unit goes up. In nondurables, where output fell and hours rose, the squeeze is sharper. These are preliminary figures; BLS revises them on 8 December 2026.
Background: a long-running gap, and rising demand
The gap between openings and hires is not new. In April 2024 the Manufacturing Institute and Deloitte projected that US manufacturers could need as many as 3.8 million new employees between 2024 and 2033, and that about 1.9 million of those jobs could stay unfilled if skills and applicant gaps are not addressed. In the same release, 65% of respondents to the National Association of Manufacturers' first-quarter 2024 survey named attracting and keeping a quality workforce as their top business challenge.
Demand is now pulling the other way. The NAM's third-quarter 2026 outlook survey, run from 11 to 27 August, found 78.9% of manufacturers positive about their outlook, up from 74.2%, with sales, production and capital investment expected to grow at the fastest rate in more than four years, and input costs expected to rise 5.0% over the next year. The Federal Reserve reported manufacturing output up 0.3% in September 2026 and capacity utilization at 75.9%. More orders, scarce people and dearer inputs point the same way: the next unit of output has to come from the lines and crews a plant already has.
Same hours, less product: what to look for
Nondurable manufacturing is a wide group: food, beverages, chemicals, paper and more. The data does not say which plants lost output, and we make no guess about any company. The pattern is still worth a look in any plant: about the same hours worked, less product out.
When output per hour falls, the cause usually sits on the line, not in the payroll. Stops get longer, lines run below rated speed, or more product is scrapped. Each of these costs paid hours without adding output.
Hiring will not fill the output gap quickly either. Openings stood at 584,000 at the end of September against 313,000 hires in the month, a wider gap than a year earlier, when there were 389,000 openings and 300,000 hires. Where posts stay open, overtime often fills the hole, and overtime hours cost more than regular ones.
Lost line time, in labor hours: a worked example
Example data, not from BLS. A packing line runs with 6 operators on a 7.5-hour shift and makes 9,000 good units, so 200 units per labor hour.
| Shift | Good units | Units per labor hour |
|---|---|---|
| Normal | 9,000 | 200 |
| 30 more minutes of stops | 8,400 | 187 (-6.7%) |
The math: the line makes 1,200 units an hour, so 30 minutes of extra stops is 600 units. To make them back, 6 operators work 30 more minutes: 3 overtime hours for one shift. If it happens on every shift, two shifts a day, five days a week, that is 30 overtime hours a week.
In money (Example data). Assume a base wage of $30 an hour, so $45 at time and a half. Then 30 overtime hours a week cost 30 x $45 = $1,350 a week, or $67,500 a year over 50 weeks (50 x $1,350), on one line, to make up output that 30 minutes of stops a shift took away. The same money spent on finding and removing the stops buys the output back without the overtime.
Short of people on the night shift? Book a demo and see good output and stop time by line and shift.
What it means for plant, production and maintenance managers
For the plant manager: retention is capacity
When there are almost two openings for every hire, keeping trained people is the cheapest capacity a plant has. A plant manager can treat quits like downtime: count them by line, shift and length of service, and look for patterns. A night shift that loses people faster, or new hires who leave in the first 90 days, point to causes that can be fixed: shift patterns, training, the first weeks on the job. With unit labor costs up 4.0% in a year, the other lever is output per paid hour, which mostly comes from fewer stops, faster running and less scrap on the lines the plant already has.
For the production manager: run fewer lines well
When a shift is short of people, spreading them across every line often means every line runs slower. A clear rule helps: a minimum crew for each line, and a ranked list of which lines to run when the crew falls short. Cross-training does the rest. Two qualified people for each position on each shift means one absence does not stop a line. Tracking time to rate for new hires, how many weeks until they match an experienced operator's output, shows whether training works or needs changing.
For the maintenance manager: fewer breakdowns, less overtime
Breakdowns are expensive twice when people are short: the line stops, and the output is often made back on overtime. The maintenance manager can link the two: each week, the top three breakdown causes next to the overtime hours they triggered. Simple checks that operators can do at the start of a shift, such as cleaning, lubrication points and looking for leaks or loose guards, free technicians for the planned work that prevents the next stop.
Three steps to take this month
- Track units per labor hour by line and shift. Good output divided by paid hours on the line. A falling number is the early warning. See our guide to units per labor hour.
- Check what overtime is paying for. Put overtime hours next to each line's stop log for the same week. If overtime follows the stops, it is covering lost line time. Our page on overtime vs OEE walks through the comparison.
- Record staffing as a stop reason. "No operator" and "waiting for a qualified person" belong in the stop list, so you can see how much line time the open posts cost. See staffing losses in OEE.
What to do this quarter
- Count quits by line, shift and tenure. Six months of leavers, sorted three ways. Look for the shift or the tenure band that loses most.
- Set a minimum crew per line. Plus a ranked list of which lines run first when a shift is short.
- Plan cross-training to two per position. For each position and shift, name two qualified people, and train the gaps first.
- Track time to rate for new hires. Weeks until a new operator reaches 80% of an experienced one's output on the same station.
- Review breakdowns against overtime weekly. Top three causes and the overtime hours each one cost.
- Hand basic checks to operators. A short written standard for start-of-shift cleaning, lubrication and visual checks.
- Re-read the data on 8 December. BLS revises third-quarter productivity then; check whether the nondurables drop holds.
Where OEE and light MES help
OEE splits lost line time into stops, slow running and rejects, so a drop in output per hour can be traced to the cause on the line.
A light MES keeps the shift reports, the stop reasons and the output counts together. Supervisors see the top loss the same day and can decide whether overtime is the answer or the symptom.
Manual stations often have no count, so their output is tallied by hand at the end of the shift. An AI camera (an add-on) that counts output removes the tally and gives a real count per hour.
Want output per person per line without spreadsheets? Our guide to OEE monitoring software covers the options.
Why units per labor hour can hide a short crew
Example data, continuing the worked example. The packing line normally makes 1,200 units an hour with 6 operators. One operator is missing, and the line runs at 1,000 units an hour with 5. Over 7.5 hours it makes 7,500 units with 37.5 labor hours: still 200 units per labor hour, the same as a normal shift. But output is down 1,500 units, 16.7%, and the line's performance factor has fallen from its normal level by the same share. Units per labor hour says the crew worked as hard as ever; OEE says the line lost a sixth of its output. A plant needs both numbers to see what a missing person costs.
How Fabrico does it
Fabrico is a cloud OEE and light MES platform. Stops come from the PLC or a Fabrico IoT device with sensors, operators add the reason on a tablet or phone, and OEE and losses show by line and shift. Where a station has no signal, AI cameras (an add-on) count output. Export to Excel or CSV, or use the REST API, to put it next to your payroll hours. We have no link to BLS; the figures above are from its releases.
Paying for overtime to make up lost line time? Book a demo.
What people ask next
How many manufacturing jobs did the US add in October 2026?
19,000, according to the BLS employment report of 6 November 2026. Durable goods added 25,000 and nondurable goods lost 6,000. Manufacturing jobs are up 101,000 since a recent low in December 2025.
Did US manufacturing productivity rise in the third quarter of 2026?
Overall, yes, by 0.3% at an annual rate. Durable manufacturing rose 2.2%, while nondurable manufacturing, which includes food and beverages, fell 1.7% as output fell 1.6% and hours rose 0.1%. BLS publishes revised figures on 8 December 2026.
How can a plant raise output without hiring?
Find the line time that is lost to stops, slow running and rejects, and recover it. Track units per labor hour by line and shift, and check whether overtime follows the stop log. See our guide to units per labor hour.
How many US manufacturing job openings were there in September 2026?
584,000, a rate of 4.4%, according to the BLS job openings report of 3 November 2026, up from 530,000 in August and 389,000 a year earlier. Manufacturing hires were 313,000, quits 199,000 and layoffs and discharges 99,000 in September.
Why did nondurable manufacturing productivity fall?
BLS reports the arithmetic, not the cause: in the third quarter of 2026, nondurable output fell at a 1.6% annual rate while hours worked rose 0.1%, so output per hour fell 1.7%. The group includes food, beverages, chemicals and paper. The figures are preliminary and will be revised on 8 December 2026.
What is the difference between labor productivity and OEE?
Labor productivity is output per hour worked, the measure BLS reports for whole industries. OEE is the share of a line's planned time that produces good units at rated speed. A short crew can keep output per labor hour flat while OEE falls, so a plant should track both, by line and shift.
Sources
All sources accessed on 14 November 2026. Dates are the publication dates shown on each page.
- US Bureau of Labor Statistics, The Employment Situation, October 2026, 6 November 2026
- US Bureau of Labor Statistics, Productivity and Costs, third quarter 2026, preliminary, 5 November 2026
- US Bureau of Labor Statistics, Job Openings and Labor Turnover, September 2026, 3 November 2026
- The Manufacturing Institute, Manufacturers Need as Many as 3.8 Million New Employees by 2033, 3 April 2024
- National Association of Manufacturers, 2026 Third Quarter Manufacturers' Outlook Survey, September 2026
- Federal Reserve Board, G.17 Industrial Production and Capacity Utilization, September 2026, 16 October 2026
Related articles




Latest from our blog






Real Fabrico tiles, sample data.