


 Login
 Blog
German Industrial Production Rose 0.7% in September: What Changeovers Teach Plants

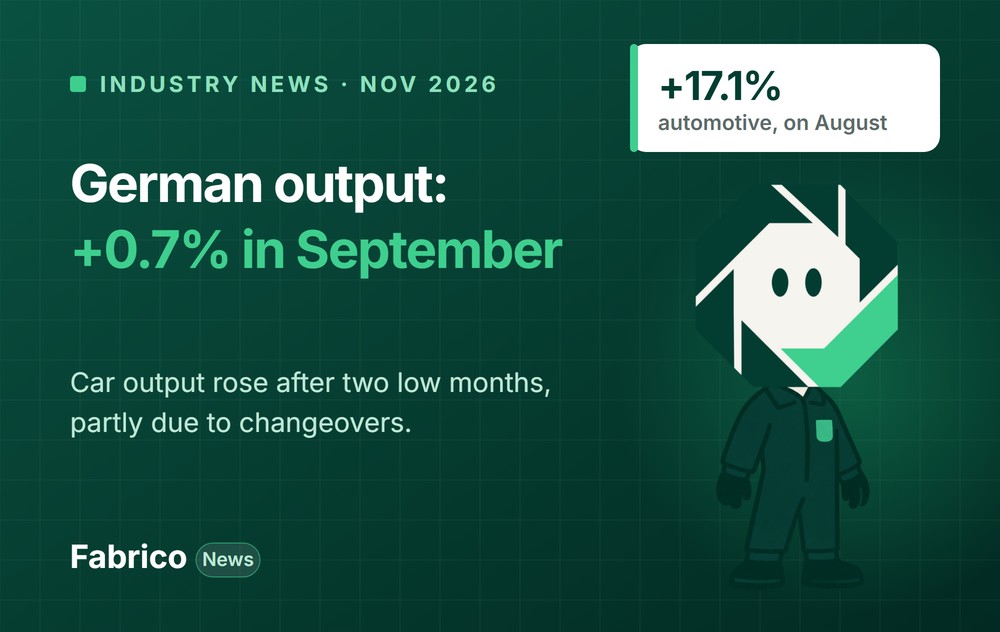
In short: German industrial production rose 0.7% in September 2026, Destatis reported on 6 November. The rise came mainly from the automotive industry, up 17.1% after two months at a low level, in part because of production changeovers and factory holidays. Over the third quarter, output was 0.4% lower than in the second, and 3.5% lower in the energy-intensive branches.
- Destatis names changeovers, with factory holidays, as part of why a whole sector's output sat low for two months. In one plant, changeovers can move a line's month too.
- In the energy-intensive branches, lower volume means fixed energy is spread over fewer good units.
- Below: what Destatis reported, production next to new orders, what it means for plant, production and maintenance managers, three steps for this month and a checklist for the quarter.
News, 13 November 2026. Every news figure below comes from a linked source, and the full list is at the end.
What Destatis reported on 6 November 2026
The Federal Statistical Office's press release No. 389 gives provisional figures for September. Changes on the month and quarter are adjusted for season and calendar; changes on a year earlier for calendar only:
- Total production: up 0.7% on August, and up 0.4% on September 2025.
- Third quarter: 0.4% lower than the second quarter.
- August revised: the rise in August is now 1.0%, down from a first estimate of 2.0%.
- Automotive industry: up 17.1% on August. Destatis says output in the two months before was low "due, in part, to production changeovers and factory holidays".
- Other branches: pharmaceuticals up 8.0%; machinery and equipment down 6.5%, after a 5.8% rise the month before; construction down 2.6%.
- Industry excluding energy and construction: up 1.7%, with capital goods up 3.0%, consumer goods up 0.8% and intermediate goods up 0.1%.
Destatis also tracks five energy-intensive branches. In 2021 they used 77% of all energy consumed by German industry and made 17% of its gross value added. Their output rose 0.8% in September, but was 3.5% lower in the third quarter than in the second, and 1.9% lower than in September 2025.
The numbers behind the news: output next to orders
Destatis published new orders one day before production. Read together, they show the gap between what factories were asked to make and what they made. Figures from release No. 389 (production) and release No. 385 (new orders, 5 November 2026), real terms, provisional.
| September 2026 | Production | New orders |
|---|---|---|
| Change on August (season and calendar adjusted) | +0.7% | +4.4% |
| August, revised | +1.0% (first estimate +2.0%) | -10.1% (first estimate -10.6%) |
| Change on September 2025 (calendar adjusted) | +0.4% | +3.3% |
| Q3 vs Q2 2026 | -0.4% | +0.2% |
| Automotive industry, on August | +17.1% | +10.5% |
| Capital goods, on August | +3.0% | +5.3% |
| Intermediate goods, on August | +0.1% | +0.5% |
| Consumer goods, on August | +0.8% | +14.4% |
Orders excluding large-scale orders rose 5.1% on the month, domestic orders 6.6% and foreign orders 2.8%. Real manufacturing turnover rose only 0.2% on the month.
Three readings follow. Orders swung hard, down about a tenth in August and up 4.4% in September, while production moved by around 1% a month. Over the quarter, orders were slightly up while production was slightly down. And in consumer goods, orders rose 14.4% on the month against 0.8% for output. None of this says how long order books are; the releases do not give that. It does say that monthly demand was far more volatile than output, which is the normal job of a plant's schedule and stock.
Background: Germany's energy-intensive branches
Destatis tracks five energy-intensive branches separately. In 2021 they used 77% of the energy consumed by German industry, made 17% of its gross value added, and employed about 930,000 people in roughly 7,000 establishments. Their output was 3.5% lower in the third quarter than in the second, and 1.9% lower than a year earlier. In those plants, furnaces, reactors and kilns use a lot of energy just to stay ready, so a drop in volume hits cost per unit harder than in assembly.
Energy also got dearer in September. Eurostat reported on 5 November 2026 that euro area industrial producer prices rose 2.5% on August, with energy up 7.8% on the month and 30.8% on a year earlier; in Germany, producer prices rose 2.0% on the month and 6.7% on the year. The German energy industry association BDEW put the average electricity price in supply contracts for small and medium industrial firms at 17.9 cents per kWh for 2026 so far, in its autumn 2026 analysis of 28 October.
Background: what carmakers and survey firms said
The car industry's own count gives a less dramatic picture than the 17.1% jump. The German Association of the Automotive Industry (VDA) counted 392,200 passenger cars made in Germany in September 2026, unchanged on September 2025, and 3.03 million in the first nine months, 4% fewer than a year earlier. Destatis's index is seasonally and calendar adjusted and compares with August, which had been low; the VDA compares unadjusted units with the same month a year earlier. Both can be right at once.
Sentiment moved up in October. The ifo Business Climate Index rose to 90.2 points from 89.9, and in manufacturing both the assessment of the current situation and expectations returned to positive territory for the first time in more than three years, with new orders up and firms planning to raise output. For a plant manager, that is a reason to prepare capacity now, starting with the hours already lost to changeovers and stops.
Changeovers and fixed energy: the two lessons
This release names production changeovers as one reason a whole sector's output sat low for two months. We do not know how any carmaker ran its changeovers and make no guess about it.
Inside a plant, the same thing happens at a smaller scale. A model change, a new pack format or a product swap takes the line out of production. When there are many of them, they can shape the month's output as much as breakdowns do.
The energy-intensive figures add a second point. When volume falls, the energy a plant uses to stay warm, pressurized or on standby does not fall with it. Each good unit carries more of that fixed energy, so energy per good unit rises even when nothing on the line has changed.
What changeovers take from a month: a worked example
Example data, not from Destatis. A line has 1,350 planned minutes a day and runs 22 days a month.
| Changeovers a day | Average length | Minutes a day | Share of planned time |
|---|---|---|---|
| Now: 6 | 35 min | 210 | 15.6% |
| After the cut: 6 | 25 min | 150 | 11.1% |
Cutting 10 minutes from each changeover frees 60 minutes a day, or 1,320 minutes a month: 22 hours of production on one line, without new equipment and without changing the product mix.
In money (Example data). Assume an hour of this line's output carries EUR 1,500 of contribution margin. Then 22 hours a month is 22 x EUR 1,500 = EUR 33,000 a month, or EUR 396,000 a year over 12 months, for one line, if there is demand for the extra output. If there is not, the same 22 hours can come off overtime or a weekend shift instead.
Changeovers eating your week? Book a demo and see every changeover logged with its start, end and product pair.
What it means for plant, production and maintenance managers
For the plant manager: plan on the trend, not the month
When orders fall a tenth one month and rise 4.4% the next, staffing and shift decisions made on one month's intake will often be wrong. A plant manager does better with a weekly view of three numbers side by side: order intake, good output and planned hours. If intake runs ahead of output for several weeks, the question is whether the plant has hidden hours to recover, in changeovers and stops, before it adds a shift. In energy-intensive plants, the same review should carry energy per good unit, because a lower-volume month raises it even when the lines run well.
For the production manager: changeovers and restarts
Destatis names production changeovers and factory holidays together, and in a plant they meet at the same point: the restart. The first shifts after a shutdown or a model change often run slower and scrap more while settings and people settle. A production manager can plan for it: stage materials before the first shift, run the simplest products first, and keep changeovers to a minimum in the first days. Logging the first two shifts' OEE after each restart, against a normal week, shows how much each restart really costs.
For the maintenance manager: use the shutdown, protect the restart
Factory holidays are the best window for jobs that need a line to stand: overhauls, inspections that need the guards off, and work on utilities. The list should be ready weeks before, with parts on site, so the window is not lost to waiting. The second job is the restart: machines that stood cold for days can fail when they start, so a short check list for the first start, for lubrication, leaks, sensors and safety devices, catches problems before production does. In idle periods, standby energy and compressed air leaks are worth a walk with a meter.
Three steps to take this month
- Log every changeover as its own stop. Record its start, end and the product pair, so the time is visible rather than hidden in "setup" or "other". Our changeover checklist is a simple way to start.
- Find the worst product pairs. Sort changeovers by length and count. The top few pairs usually hold most of the time, and they are where a SMED effort pays first.
- Split idle time from losses. Mark "no orders" or "line not planned" apart from breakdowns and changeovers. Then OEE shows the line's own losses, and your meter readings divided by good units show energy per unit.
What to do this quarter
- Put intake next to output. Each week, order intake, good output and planned hours per line or area, on one page.
- Prepare the year-end shutdown list now. If your plant stops over the holidays, list the jobs, order the parts and book the contractors before the end of November.
- Measure restart losses. OEE for the first two shifts after each shutdown or model change, against a normal week.
- Read standby energy. Meter one non-production weekend. That number, divided by a normal week's good units, is the fixed energy each unit carries.
- Set a standard for the top three product pairs. The three longest changeovers get written steps and a target time.
- Plan staffing for a range. Write down what the plant does at 5% less and 5% more volume, so a swing in orders does not force a rushed decision.
Where OEE and light MES help
OEE puts changeovers inside availability, next to breakdowns and waiting, so their share of the month is a number the team can track.
A light MES records each changeover with its product pair and length, and the shift report shows the longest ones the same day.
On manual stations with no machine count, such as hand packing after a filler, an AI camera (an add-on) that counts output shows, from the count, how fast the station gets back to rate after each changeover.
Cutting changeovers and need to prove it? Our guide to measuring SMED results in OEE shows how to track each changeover before and after.
Why OEE can stay flat while output falls
Example data. A line plans 1,350 minutes a day on 22 days. In a weak month, 4 of those days have no orders, so the line is not planned. OEE counts only planned time, so it can stay at 65% while output falls by 4 / 22 = 18%. That is correct: the line ran as well as before, it just ran less. The cost shows elsewhere. If the line carries 40,000 kWh a month of fixed energy and good units fall from 100,000 to 82,000, fixed energy per unit rises from 0.40 to about 0.49 kWh. Recording "no orders" as its own reason keeps both numbers honest. At BDEW's 17.9 cents per kWh, that fixed energy rises from about EUR 0.072 to about EUR 0.087 per unit (0.40 and 0.49 kWh x EUR 0.179).
How Fabrico does it
Fabrico is a cloud OEE and light MES platform. Stops come from the PLC or a Fabrico IoT device with sensors, and operators mark each one as a changeover, breakdown or other reason on a tablet or phone. Where a station has no signal, AI cameras (an add-on) count output. OEE and losses show by line and shift. Fabrico does not meter energy itself; data leaves through Excel or CSV export or the REST API, so you can put good units next to your own meter readings. We have no link to Destatis; the figures above are from its release.
Losing hours to changeovers every month? Book a demo.
What people ask next
How much did German industrial production rise in September 2026?
By 0.7% on August, seasonally and calendar adjusted, according to Destatis on 6 November 2026. Compared with September 2025 it was up 0.4%. Over the third quarter, production was 0.4% lower than in the second.
Why did German car production jump in September 2026?
Destatis reported a 17.1% rise in the automotive industry on the previous month and said output in the two months before was low, partly because of production changeovers and factory holidays.
How much production time do changeovers take?
It depends on the line, so measure it. A line with six changeovers a day at 35 minutes loses 210 minutes, 15.6% of 1,350 planned minutes. That is example data; log your own changeovers with their product pairs. See our changeover checklist.
How did German factory orders change in September 2026?
Real new orders in manufacturing rose 4.4% on August, seasonally and calendar adjusted, and 5.1% excluding large-scale orders, according to Destatis on 5 November 2026. August was revised to a 10.1% fall. Orders in the automotive industry rose 10.5%, and in the third quarter total orders were 0.2% above the second.
What are Germany's energy-intensive industrial branches?
Destatis tracks five branches with high energy demand relative to their gross value added. In 2021 they used 77% of German industry's energy, made 17% of its gross value added and employed about 930,000 people in roughly 7,000 establishments. Their output was 3.5% lower in the third quarter of 2026 than in the second.
Why does energy per unit rise when output falls?
Part of a plant's energy is fixed: heating, pressure, standby and lighting run whether the line makes 80,000 or 100,000 units. When volume falls, that fixed energy is spread over fewer good units, so energy per unit rises even if the lines run as well as before. Meter a non-production period to see your fixed share.
Sources
All sources accessed on 14 November 2026. Dates are the publication dates shown on each page.
- Destatis (Federal Statistical Office), Production in September 2026: +0.7% on the previous month, press release No. 389, 6 November 2026
- Eurostat, Industrial producer prices up by 2.5% in the euro area and by 2.6% in the EU (euro indicators), 5 November 2026
- BDEW, BDEW-Strompreisanalyse Herbst 2026, 28 October 2026
- VDA, Production and market in September 2026, 4 October 2026
- ifo Institute, ifo Business Climate Rises (October 2026), 26 October 2026
- Destatis (Federal Statistical Office), New orders in manufacturing in September 2026: +4.4% on the previous month, press release No. 385, 5 November 2026
Related articles




Latest from our blog





Real Fabrico tiles, sample data.