


 Login
 Blog
US Machine Tool Orders Pass $1 Billion in September 2026: Make the New Machines Count

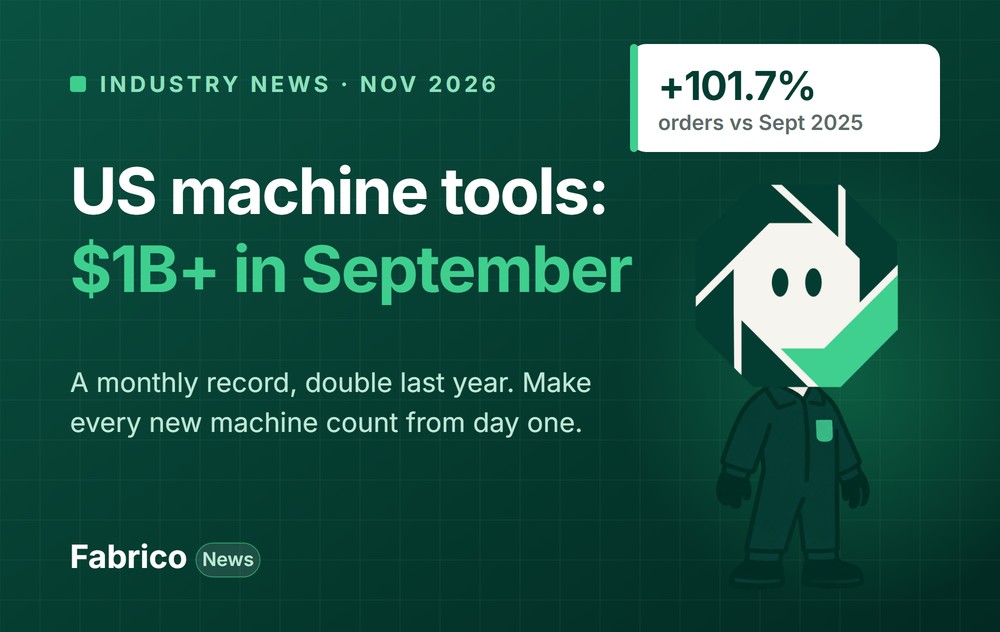
In short: US orders of metalworking machinery reached $1,007.3 million in September 2026, the first month above $1 billion, according to AMT's report of 9 November 2026. Orders were 101.7% above September 2025, and the number of machines ordered was the highest since September 2014.
- AMT points to a growing appetite for automation as the main driver, with job shops and aerospace at record levels.
- A new machine is only an investment if it runs. The first months after delivery decide how much of the capacity you paid for you actually get.
- Below: what AMT reported, the regional and machine numbers, what it means for plant, production and maintenance managers, three steps to measure a new machine from day one and a checklist for this quarter.
News, 13 November 2026. Every news figure below comes from a linked source, and the full list is at the end.
What AMT reported on 9 November 2026
AMT, The Association For Manufacturing Technology, publishes the U.S. Manufacturing Technology Orders (USMTO) report every month. Its September 2026 release includes orders placed at the IMTS 2026 trade show.
- Total: $1,007.3 million in September, up 38.0% from August and 101.7% from September 2025.
- Record: 22.5% above the previous monthly record, set in December 2025.
- Units: the count of new machines ordered was the highest since September 2014.
- Year to date: $5.76 billion through September, 45.0% above the same period of 2025.
- Streak: the seventh month in a row above half a billion dollars, the longest such run in the report's records.
By customer, job shops set a record nearly 25% above the previous record, set in August 2026. Aerospace orders hit record value and unit levels. Automotive orders were the highest since July 2020. AMT says the appetite for automation drives most of the growth in order value, and expects orders to stay elevated into 2027.
The numbers behind the news
AMT's release carries a table by region and a monthly count of machines. Figures below are from the USMTO release of 9 November 2026, in millions of dollars.
| Region | Sept 2026 | vs Aug 2026 | vs Sept 2025 | Year to date |
|---|---|---|---|---|
| West | $210.7 | -13.9% | +135.9% | $1,448.1 (+72.6%) |
| Northeast | $205.2 | +80.0% | +136.0% | $954.8 (+55.6%) |
| North Central-East | $175.5 | +45.0% | +60.5% | $1,053.6 (+18.3%) |
| North Central-West | $172.9 | +52.6% | +109.1% | $946.7 (+43.8%) |
| Southeast | $122.7 | +37.5% | +60.8% | $773.5 (+43.2%) |
| South Central | $120.2 | +151.4% | +120.0% | $585.4 (+35.2%) |
| United States | $1,007.3 | +38.0% | +101.7% | $5,762.1 (+45.0%) |
The same release counts machines. Cutting machines ordered:
| Month | Cutting machines (units) | Value ($ thousands) | Average value per machine (our arithmetic) |
|---|---|---|---|
| Sept 2025 | 1,811 | 486,861 | about $269,000 |
| Aug 2026 | 2,335 | 718,943 | about $308,000 |
| Sept 2026 | 3,434 | 989,498 | about $288,000 |
Metal forming and fabricating machines were a small part: 37 units worth $17.8 million in September. The averages explain a line in AMT's text: units grew faster than value in September, so the average machine ordered was cheaper than in August. AMT reads this as a possible sign that buyers choose the shortest lead time, even if it means fewer features. Every region except the West ordered more than in August, and every region ordered more than a year earlier.
Background: an expansion that began in September 2024
AMT dates the current expansion in orders to September 2024 and links its staying power to three things: the appetite for automation, industries with long backlogs and lead times, and defense production. Growth was uneven. Aerospace orders set records in value and units, 5.0% and 8.9% above the previous peak in December 2025. Automotive orders were the highest since July 2020, but orders from transmission makers pulled back after months of investment to move from battery electric toward ICE and hybrid powertrains, and stamping has stayed muted. Contract machine shops, the largest customer group, set a record too.
Timing matters as well. September includes orders placed at IMTS 2026, which AMT says had 91,295 registrants and 1,788 exhibiting companies, and the last month with as many machines ordered, September 2014, was also an IMTS month. AMT expects leads from the show to turn into more orders in the coming months, so the delivery wave for buyers is still ahead.
Independent data: orders, capacity and people
Other sources point the same way. The US Census Bureau reported on 3 November 2026 that new orders for manufactured goods rose 1.8% in September to $677.2 billion, and shipments 1.3% to $668.5 billion. The Federal Reserve put manufacturing capacity utilization at 75.9% in September. Demand for machines is not only American: the Japan Machine Tool Builders' Association reported preliminary orders of 204,377 million yen in October 2026, 42.5% more than a year earlier, about three quarters of them from abroad.
People are the other constraint. The BLS employment report counted 1,104,000 jobs in machinery manufacturing and 1,468,600 in fabricated metal products in October 2026, up about 19,400 and 29,900 on a year earlier. New machines need programmers, setters and maintenance technicians, and those come from the same tight labor market.
After the order: where new capacity gets lost
A record month of orders, with the most machines ordered since September 2014, means many new machines arriving over the next year. AMT itself notes signs that buyers may pick the shortest lead time over extra features.
The risk sits after delivery. A new CNC cell is bought on its rated capacity, but its real output depends on spindle time: how long it runs, how fast, and how much of it is good. Long first-article runs, missing programs, waiting for material and slow changeovers can keep a new machine far below plan for months, and nobody sees it in a monthly report.
The cost of a slow ramp: a worked example
Example data, not AMT's. A new machining cell, 100 planned hours a week, planned at 75% OEE.
| Month after delivery | OEE | Good hours a week | Gap to plan |
|---|---|---|---|
| 1 | 40% | 40 | 35 h |
| 2 | 52% | 52 | 23 h |
| 3 | 63% | 63 | 12 h |
Good hours are planned hours times OEE: 100 x 40% = 40. At about 4.3 weeks a month, the gap over the first three months adds up to about 4.3 x (35 + 23 + 12) = 301 hours, three full weeks of planned time. Each week the cell reaches plan sooner is capacity you already paid for.
In money (Example data). Assume each good hour from the cell carries $180 of contribution margin. The 301-hour gap is then 301 x $180 = $54,180 in the first three months, from one cell. Reaching 75% one month earlier would recover the month-3 gap of about 4.3 x 12 = 52 hours, or about $9,360.
Have a new CNC cell on order? Book a demo and see how its ramp is tracked week by week.
What it means for plant, production and maintenance managers
For the plant manager: buy the data with the machine
If buyers are picking the shortest lead time over features, as AMT suggests may be happening, one feature is worth keeping on the list: access to the control's data. Run state, part count, alarms and program numbers are what make a machine measurable from its first day. The plant manager also owns the business case. It was most likely built on spindle hours and cycle times; the plant should check those numbers against reality in the first quarter, not at the year-end review, when a slow ramp has already cost months of the capacity that was paid for.
For the production manager: programs, fixtures and routings first
A new machine waits for three things that are not machines: proven programs, fixtures and the routing changes that send it work. Having the first jobs programmed, simulated and fixtured before delivery shortens the first month more than anything else. The production manager also decides what moves off the old machines and what stays as backup, and changes the routings and the quoting cycle times when the new machine's real times are known. In a job shop, quoting on the brochure cycle time rather than the measured one is how a record order book turns into late deliveries.
For the maintenance manager: installation is half the job
Foundations, power, compressed air, coolant and chip handling decide how smoothly a new machine starts. Maintenance should have the manufacturer's PM schedule, the spare parts list and the training before acceptance, not after the first alarm. The machines being replaced or off-loaded still need care: if they become backup, they need a light PM plan, not none. Logging each alarm and stop on the new machine in its first 90 days, with a reason, builds the case for warranty claims and shows which faults repeat.
Three steps to measure a new machine from day one
- Connect it before the first part. Take run, stop and count from the control on the day of commissioning. Our guide to CNC machine monitoring lists the usual signals.
- Agree the target ramp. Write down the OEE you expect in months 1, 2 and 3, and review it weekly with the supplier and the team.
- Code the big losses. Programs, material, setup and first-article checks are the usual ramp losses. A short reason list shows which one to fix first.
What to do this quarter
- Write the acceptance test. Run-off parts, target cycle time and the quality check each new machine must pass before you sign it off.
- Put data access in the purchase order. State which signals you need from the control (run state, part count, alarms, program) and through which interface, such as MTConnect or OPC UA.
- Prove the first ten jobs before delivery. Programs simulated, fixtures built, tools listed.
- Baseline the machines being off-loaded. Four weeks of OEE on the old machines, so the gain from the new one can be shown.
- Book the utilities. Power, air, foundation and coolant work dated and owned, so the machine does not wait on the floor.
- Train before arrival. Operators, programmers and maintenance trained on the control and the machine before it runs production.
- Update quoting after four weeks. Replace planned cycle times with measured ones for the top jobs.
Where OEE and light MES help
OEE monitoring shows the ramp as it happens, per machine and per shift, instead of at month end. A light MES adds jobs, parts and the reasons operators enter, so the ramp review is about causes, not opinions.
Which OEE factor holds a new machine back
Example data, continuing the worked example. In month 2, the cell runs at 70% availability, 80% performance and 95% quality: 0.70 x 0.80 x 0.95 = 53.2%, close to the 52% in the table. Performance is low because the programs run at cautious feeds: 7.5 minutes a part against a planned 6. Bringing the cycle down to 6.5 minutes lifts performance to 6 / 6.5 = 92.3% and OEE to 0.70 x 0.923 x 0.95 = 61.4%, with no change in stops or scrap. Splitting OEE this way tells the team whether the next gain is in programming, in waiting for material or in first-article checks.
How Fabrico does it
Fabrico is a cloud OEE and light MES platform. It shows OEE and losses by machine, line and shift from the machine control or a Fabrico IoT device, with the reasons operators add on a tablet or phone. Where there is no signal, AI cameras (an add-on) count output. We have no link to AMT; the figures above are from its release.
Planning a new machine or cell? Book a demo.
What people ask next
How high were US machine tool orders in September 2026?
New orders of metalworking machinery totaled $1,007.3 million in September 2026, up 38.0% from August and 101.7% from September 2025, according to AMT's USMTO report of 9 November 2026. It was a monthly record, 22.5% above December 2025.
Why are US machine tool orders so high in 2026?
AMT says the main driver is a growing appetite for automation, together with demand from industries with long backlogs and lead times and defense production. September also included orders placed at IMTS 2026.
How long does a new CNC machine take to reach its planned output?
It depends on programs, material flow, setups and first-article checks. The only way to know is to measure OEE from the first day and compare it each week with a written ramp target. See our guide to CNC machine monitoring.
Which US regions ordered the most machine tools in September 2026?
According to AMT's USMTO release of 9 November 2026, the West ordered $210.7 million and the Northeast $205.2 million. South Central orders rose the most on the month, by 151.4%, to $120.2 million. Year to date, the West led with $1,448.1 million, up 72.6%.
How many machine tools were ordered in the US in September 2026?
AMT counted 3,434 cutting machines worth about $989.5 million and 37 metal forming and fabricating machines worth about $17.8 million. The count of new machines was the highest since September 2014.
What should a purchase order for a new CNC machine include so it can be measured?
An acceptance test with run-off parts and a target cycle time, and access to the control's data: run state, part count, alarms and program number, through a stated interface such as MTConnect or OPC UA. Then OEE can be measured from the first day.
Sources
All sources accessed on 14 November 2026. Dates are the publication dates shown on each page.
- AMT, IMTS Drives Manufacturing Technology Orders Past $1B in September 2026 (USMTO release, PDF), 9 November 2026
- AMT, USMTO press releases, 9 November 2026
- US Census Bureau, Full Report on Manufacturers' Shipments, Inventories and Orders, September 2026 (figures from the September 2026 release; this URL always shows the latest release), 3 November 2026
- Federal Reserve Board, G.17 Industrial Production and Capacity Utilization, September 2026, 16 October 2026
- Japan Machine Tool Builders' Association, statistics (preliminary orders, October 2026), 11 November 2026
- US Bureau of Labor Statistics, The Employment Situation, October 2026 (Table B-1), 6 November 2026
Related articles










Real Fabrico tiles, sample data.