Login
 Blog
OEE for Paint and Coatings Manufacturing: Batch, QC and Filling

Key takeaways
- Measure OEE on the batch side and on the filling side separately. One combined figure hides where the time goes.
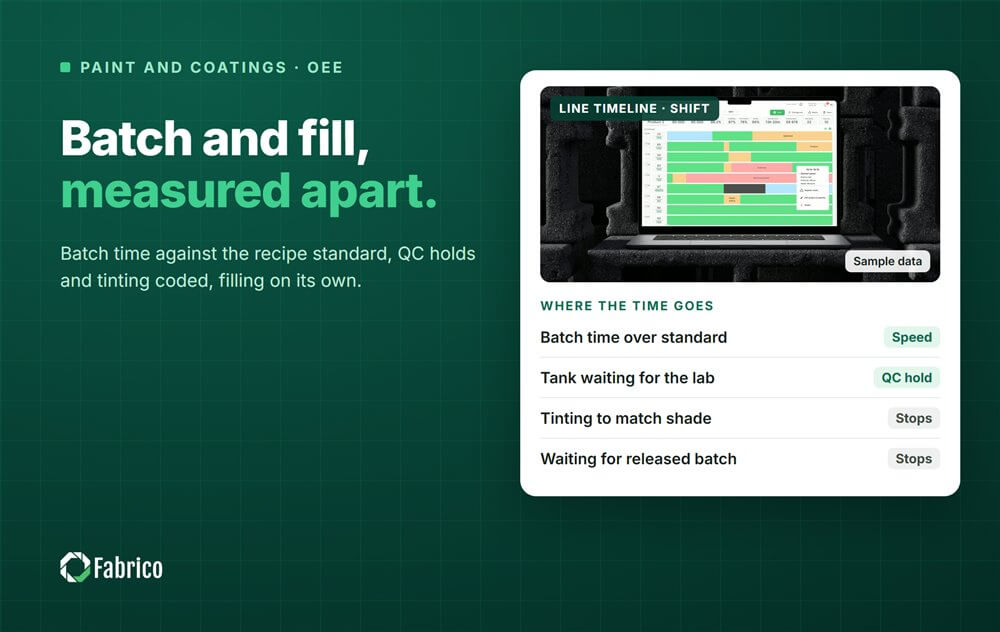
- On dispersers and let down tanks, Performance compares the actual batch time with the standard batch time for the recipe.
- QC hold and shading rounds are real losses. Code the time a full tank waits for the lab and the time spent tinting to match.
- On filling lines, waiting for a released batch is an Availability loss with an upstream cause, not a filler problem.
- Colour changes cost cleaning time and product sent to wash. Time and weigh both.
The let down tank for the morning's white batch has been full since ten o'clock. The lab has the sample, the shading is on its second round, and the filling line next door is changing to another product because nothing else is released. On paper, nothing is broken. In OEE terms, two assets are losing time at once, for one reason that sits in neither machine.
This guide is for plant managers, production managers and CI leads in decorative and industrial paint plants. It covers why batch and filling need separate OEE figures, how to measure Availability, Performance and Quality on dispersion and let down vessels, how to treat QC hold and tinting, how to measure the filling lines, and what colour changes really cost.
How a paint plant runs: two different processes
A paint plant joins a batch process to a packaging process, and each runs on its own clock.
- Weighing and premix. Binder, solvent or water, pigments, extenders and additives are weighed and charged.
- Dispersion. A high speed disperser wets and breaks up the pigment. Some products go on through a bead mill until the fineness of grind, checked with a Hegman gauge, is right.
- Let down. The rest of the binder, solvent and additives are mixed in at lower speed.
- QC and shading. The lab checks viscosity, colour, gloss and density. If the colour is off, colourants are added and the batch is tested again.
- Filtration and transfer. The released batch goes through filters to a holding tank or straight to filling.
- Filling. Cans, pails, drums or IBCs are filled, lidded, labelled and palletised.

Why batch and filling need separate OEE
A batch vessel and a filling line do different work. The vessel turns raw materials into litres of approved paint, measured in batches. The filling line turns approved paint into packs, measured in cans a minute. Multiplying the two into one plant OEE gives a number nobody can act on.
Measure each one on its own terms, and link them through one reason code: waiting for a released batch on the filling side, and waiting for filling on the batch side. Those two codes show which side is holding the other back. Our guide to OEE in batch manufacturing explains the batch method in full, and OEE across multiple machines covers how to roll assets up without mixing them.
OEE on the batch side: dispersion and let down
Treat each vessel, or each disperser and let down tank pair, as one asset.
- Availability = time the vessel is processing a batch / planned time. Cleaning, waiting for raw materials, waiting for QC release and waiting for the filling line to empty the tank are all losses with their own codes.
- Performance = standard batch time x batches completed / processing time. The standard batch time per recipe is the best proven time to charge, disperse and let down, without waiting.
- Quality = litres released right first time / litres made. Batches that need rework, product lost to the tank heel and filter losses count against it.
Set the standard batch time from a good, uninterrupted batch for that recipe, not from the average. A batch that runs over standard because pigment charging was slow, or because the mill was shared, is a Performance loss with a reason.
QC hold and tinting time
QC hold is the loss paint plants most often leave out. The batch is made, the tank is full, and it waits for a sample result. The vessel cannot start the next batch, and the filling line may be waiting too. Code it as waiting for QC, with the time the sample was taken and the time the result came back.
Shading is different. Each round of adding colourant and testing again adds time to the batch. Book that time as part of the batch, and record the number of rounds. A recipe that needs three rounds on most batches points at raw material variation or the recipe itself, not at the operator who tints it.
When QC hold is large, the lab may be the real constraint of the plant. Adding another disperser will not help if every batch queues for the same spectrophotometer.
OEE on the filling line
The filling line is a packaging line, and its OEE works like any other. Set the ideal rate in cans a minute for each pack size, from the filler's rated speed.
- Typical short stops. Can denesting jams, lid feeder jams, lids not pressed home, label faults, dripping nozzles.
- Typical long stops. Pack size changes, colour change flushes, waiting for a released batch, no cans or lids.
- Quality. Checkweigher rejects, dented or leaking cans, wrong labels.
Overfill that passes the checkweigher is giveaway, not a Quality loss in OEE. Track it next to OEE, in money; our guide to giveaway and overfill shows how. When the filler waits for paint, charge the time to the batch side. Our article on starvation and blocking explains the rule.
Colour changes and cleaning
Every colour change costs twice: cleaning time, and product or wash material sent to waste. Waterborne paints are washed with water, solventborne paints with solvent, and both create waste to handle.
Time each change from the last good can of one colour to the first good can of the next, on the filling line, and from batch transfer to the next charge on the vessel side. Weigh the wash and the product lost. Many plants run colours from light to dark to shorten cleaning, a sequencing choice that belongs to planning. Our guide on how to reduce changeover time covers preparing lids, labels and filters outside the stop.
Data sources: what each one sees
| Source | What it gives you | What it misses |
|---|---|---|
| Tank load cells | Batch start, additions, transfer out | Why a full tank is waiting |
| Disperser and mill drives | Run state, speed, power | Whether the batch is in spec |
| Lab timestamps | Sample taken, result, release: the QC hold | Shading decisions nobody writes down |
| Filler PLC and checkweigher | Run state, count, fill weights, rejects | Why the filler waited |
| Operator input | Reason, batch, colour, pack size | Short stops too brief to record |
| Camera on the filling line | A clip of the lid feeder or the can infeed at the moment of a stop | What happens inside a closed vessel |
The PLC is the clock for the filling line. Where a camera watches the lid feeder or the can infeed, the clip shows the jam that the run signal reports only as stopped. A model can suggest the reason, and the operator confirms it in one tap.
A worked example: one batch unit and one filling line
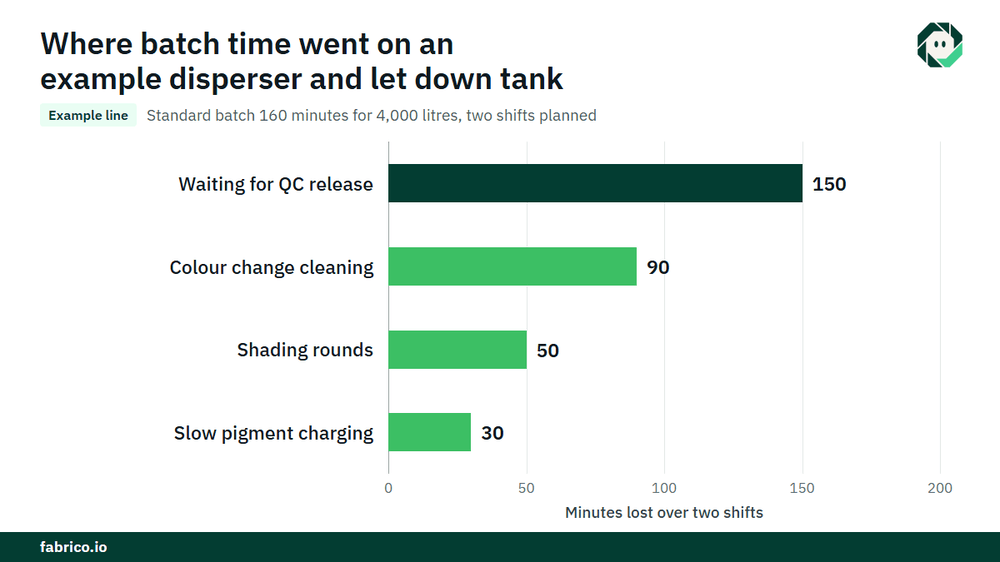
Sample line (illustrative numbers, not a customer): a disperser and let down tank pair makes a recipe with a standard batch time of 160 minutes for 4,000 litres, so 25 litres a minute. It is planned for two shifts, 960 minutes.
- Not processing: 150 minutes waiting for QC release and 90 minutes of colour change cleaning. Processing time = 960 minus 240 = 720 minutes. Availability = 720 / 960 = 75.0%.
- Four batches done. Standard time = 4 x 160 = 640 minutes. Performance = 640 / 720 = 88.9%. The extra 80 minutes are two shading rounds (50) and slow pigment charging (30).
- Made 16,000 litres; 320 litres lost to rework, tank heel and filters. Good = 15,680 litres. Quality = 15,680 / 16,000 = 98.0%.
- Batch OEE = 0.75 x 0.889 x 0.98 = 65.3%. Check: 15,680 / 25 = 627.2 minutes, and 627.2 / 960 = 65.3%.
| Filling line, 2.5 litre cans | Value |
|---|---|
| Planned time, rated speed | 480 minutes, 40 cans a minute |
| Stops: waiting for a released batch, colour and size change, lid jams | 60 + 40 + 20 = 120 minutes |
| Availability | 360 / 480 = 75.0% |
| Performance | 12,960 cans / (360 x 40 = 14,400) = 90.0% |
| Quality | 12,636 good / 12,960 = 97.5% |
| Filling OEE | 0.75 x 0.90 x 0.975 = 65.8%; check 12,636 / 40 / 480 = 65.8% |
Price the QC hold. The 150 minutes are 150 x 25 = 3,750 litres of batch capacity. At a contribution of $0.80 a litre (€0.80 in a euro plant), that is $3,000 over the two shifts, if the batch side is the constraint and the plant is sold out. On 250 working days, it comes to $750,000, or €750,000. The same delay shows up again on the filling line as waiting for a batch, so count its money once, on the side that caused it.
Where Fabrico fits
Fabrico is a computer vision enabled Manufacturing Performance Platform. In a paint plant it starts with OEE and light MES: automatic downtime logging from the machine signals and OEE live by line and shift, starting with the filling lines.
- Losses priced in money and ranked by money, so QC hold, a long colour change and lid jams are compared in one currency.
- The operator confirms the reason in one tap, including waiting for a released batch.
- A camera clip as evidence for a stop where a camera watches the lid feeder or the can infeed.
- A work order to the right technician, with its cost, when a stop is a breakdown.
- One view across plants for groups with several paint sites.
You can start on one line, with a baseline and a decision date agreed in advance. Each plant gets a quote after a review of its lines.
Frequently asked questions
How do you calculate OEE for a paint batch process?
Availability is processing time over planned time. Performance is standard batch time times batches completed, over processing time. Quality is litres released right first time over litres made.
Should QC hold time count against OEE?
Yes, on the batch side. A full tank waiting for a lab result cannot make the next batch. Code it as waiting for QC so the lab's share of the loss is visible.
Should batch and filling OEE be combined into one number?
No. Report them separately and link them with the waiting codes. A combined figure hides which side is holding the other back.
How do colour changes affect OEE in paint manufacturing?
They cost cleaning time in Availability on both sides, and product or wash sent to waste. Time each change and weigh the waste.
What is a good OEE for a paint plant?
There is no standard benchmark for paint plants, and batch and filling OEE differ by nature. Compare each asset with its own baseline and track the trend by recipe and pack size.
See your plant's losses in a demo
Bring one filling line and its downtime log. We will show where the minutes go and what each loss costs.
Latest from our blog