


 Login
 Blog
OEE Over 100%: 6 Causes and How to Fix the Data

Key takeaways
- A machine cannot make more good product than its planned time allows at the ideal speed. So over 100% is a data error.
- Performance is where it usually shows. The classic cause is an ideal speed set from a good day.
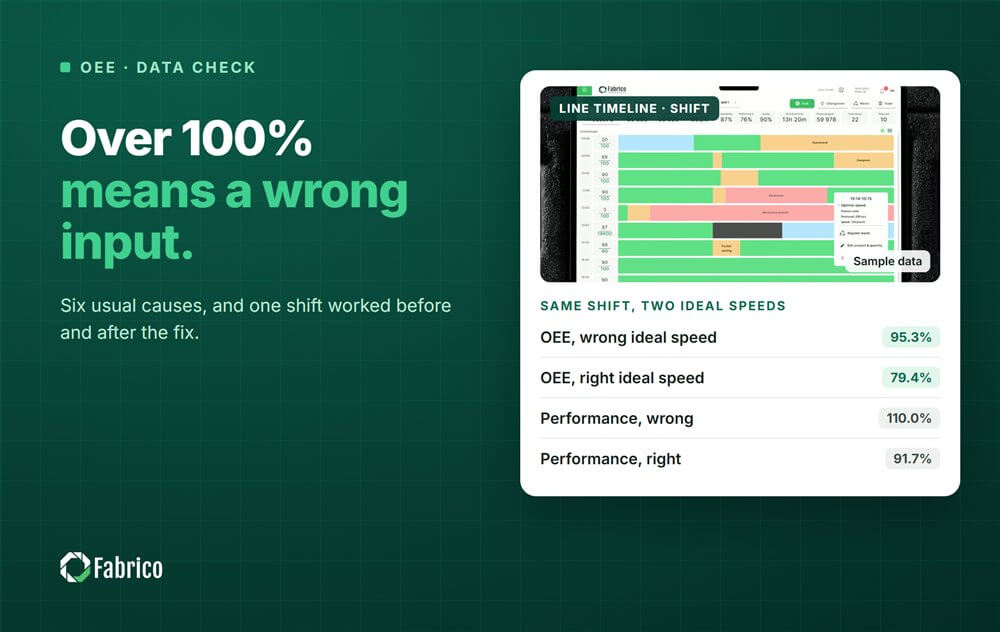
- One wrong ideal speed turned a 79.4% shift into 95.3% in the worked example.
- Never cap the number. Fix the input instead.
Fabrico, OEE and light MES (manufacturing execution system) software with AI cameras, logs stops automatically and shows OEE live by line and shift. A figure over 100% is seen the same day.
Below are the six usual causes, a worked shift before and after the fix, and a quick way to find your own cause.
Why can OEE never be above 100%?
OEE = good count x ideal cycle time / planned production time. The top of that fraction is the time the good product needed at the fastest speed. That time cannot be longer than the time the line was planned to run.
So a result over 100% means one of three things. The ideal cycle time is too long, the count is too high, or the planned time is too short.
Run time cancels out of the formula. If stops are logged twice, Availability falls and Performance rises in proportion. Performance may go over 100%, but OEE stays the same.
What are the 6 causes of OEE over 100%?
| Cause | What you see | Fix |
|---|---|---|
| 1. Ideal speed set too slow | Performance over 100% on most shifts | Use the nameplate or the fastest proven rate |
| 2. Count in the wrong unit | Jumps on some products only | Convert to one unit per line |
| 3. Count from the wrong place | Output higher than the filler could make | Count at the machine you measure |
| 4. Planned time too short | OEE or Availability over 100% on some shifts | Add every minute the line ran to planned time |
| 5. Shift boundaries | Over 100% on the first or last shift | Cut counts and time at the same moment |
| 6. Product changed, speed did not | Over 100% after a changeover | Load the rated speed with each order |
Check cause 1 first. Christoph Roser warns against taking the average speed of a good day as the top speed. It is one of his three classic ways OEE gets inflated. The ideal is the fastest the process can run, not a good day. Our guide to ideal cycle time shows how to set it.
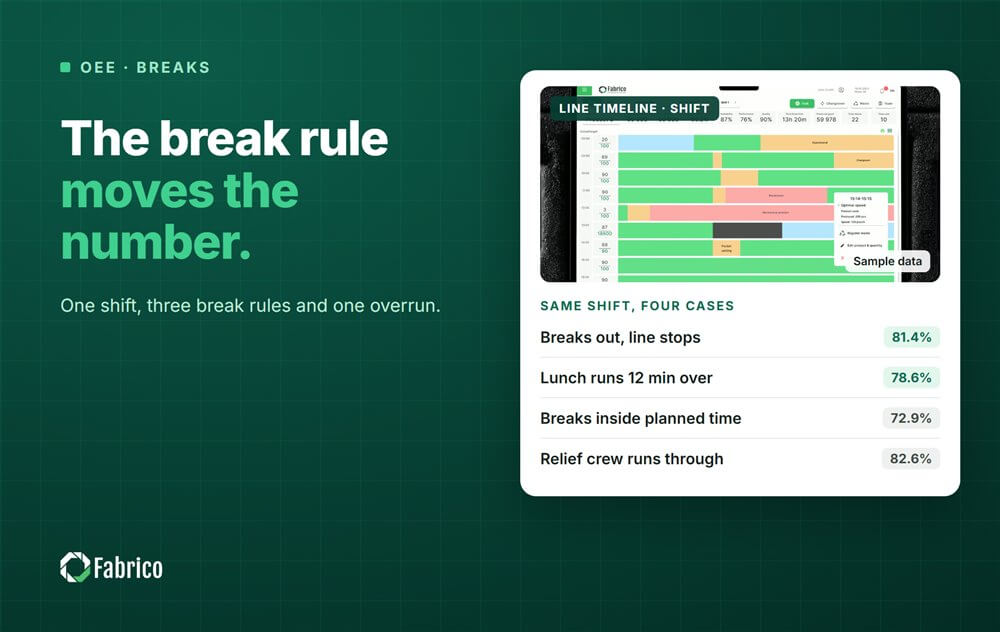
Cause 4 happens when the line runs through a break, a "no order" slot or overtime that never made it into planned time.
What does a worked example look like before and after the fix?
Sample line (illustrative numbers, not a customer): a filling machine on a 480 minute shift with 60 minutes of stops. It filled 23,100 units, and 99% were good.
The system uses an ideal cycle time of 1.2 seconds, set years ago from a good day on an older product. Today's product is rated at 1.0 second.
| Figure | With 1.2 s (wrong) | With 1.0 s (right) |
|---|---|---|
| Run time | 420 min | 420 min |
| Availability | 87.5% | 87.5% |
| Performance | 110.0% | 91.7% |
| Quality | 99.0% | 99.0% |
| OEE | 95.3% | 79.4% |
- Performance with 1.2 s = 23,100 x 1.2 / 25,200 seconds of run time = 110.0%.
- Performance with 1.0 s = 23,100 x 1.0 / 25,200 = 91.7%.
- Count check: 22,869 good units x 1.0 second = 381.15 minutes. 381.15 / 480 = 79.4%.
The wrong ideal speed did more than push Performance over 100%. It made this shift look almost 16 points better, at a believable 95.3%. That is the real danger.
Should you cap a Performance figure that is over 100%?
No. A cap makes the dashboard tidy and keeps the wrong input in place. Every later shift is then reported a little too high, and nobody knows by how much.
Flag any shift over 100% and send it to the owner of the rated speeds. If the machine really ran faster for a sustained period, the rated speed was wrong. Raise it to the demonstrated best. Our OEE Performance guide shows the formula behind each check.
How do you find the cause in your own data?
- List every shift with OEE or Performance over 100% in the last month.
- Group them by product. If one product causes most, check its rated speed.
- Group them by shift. If the first or last shift of the week stands out, check the boundaries.
- Compare the count with what the bottleneck could make in the run time. If the count is higher, check the counter and the unit.
- Compare planned time with the minutes the line really ran. Running through a break or into overtime belongs in planned time.
Once the inputs are fixed, OEE often drops by several points. The line did not get worse; the number got honest. Our article on why OEE benchmarks are often wrong explains why.
What mistakes do plants make when OEE goes over 100%?
- Capping the number and moving on.
- Lowering the rated speed when the line beats it, instead of raising it.
- One rated speed for every product on the line.
- Counting after a buffer that carries stock into the next shift.
- Running through breaks without adding that time to planned time.
Where Fabrico fits
Fabrico is a computer vision enabled Manufacturing Performance Platform. OEE and light MES come first. With automatic downtime logging and OEE live by line and shift, a figure over 100% shows up the same day.
- Automatic downtime logging from the machine signal, so run time is not a guess.
- The operator confirms the reason in one tap, so breaks and stops are not mixed up.
- OEE live by line and shift, so a wrong input shows up on the shift it happens.
Where a stop is in doubt, a camera clip is evidence for what the line was doing. You start on one line, with a baseline and a decision date agreed in advance. There is no free plan and there are no tiers: each plant gets a quote.
Frequently asked questions
Can OEE be over 100%?
No. A figure over 100% tells you an input is wrong. The ideal cycle time is too long, the count is too high, or the planned time is too short. Find which one it is, fix it in the system, and recalculate the shifts it touched, so the trend stays honest.
Can Performance be over 100%?
Only when the data is wrong. Usually the rated speed in the system is lower than what the machine really does. Performance can also go over 100% when stops are logged twice, because run time shrinks. In that case Availability falls by the same factor and OEE does not change.
Should I cap OEE when it goes over 100%?
No. A cap hides the error and keeps every later shift reported too high. Flag the shift instead, find the wrong input, and fix it at the source. A number that cannot be true is useful: it points straight at the setting or the counter you need to check.
What if the machine really runs faster than its rated speed?
Then the rated speed is too low. Raise it to the fastest proven rate the machine sustains on that product. Review it whenever the machine or the product changes. Never lower a rated speed to make OEE look better, because that hides the speed loss you want to find.
Why did our OEE drop after we fixed the rated speeds?
Because the old number was inflated. The line did not get worse; the measure got honest. The gap you see now is real capacity to win back. Explain this to the team before the new number goes on the screen, so nobody reads it as blame.
Check your OEE inputs in a demo
Bring one line, its rated speeds and a week of counts. We will show which shifts are over 100% and why.
Latest from our blog





Real Fabrico tiles, sample data.