







 Login
 Blog
OEE per SKU: How to Calculate OEE With Different Rated Speeds

Key takeaways
- When products run at different speeds, add the ideal time per SKU (stock keeping unit), not the units.
- OEE = sum of (good units / rated speed) per SKU / planned production time.
- In the worked example the right figure is 57.8%. One rate for all SKUs gives 45.6% or 91.1%.
- Per-SKU OEE shows which products cost the line most, so mix decisions use facts.
Fabrico, OEE and light MES (manufacturing execution system) software with AI cameras, logs stops automatically and ranks losses by money. The SKUs that cost most stand out.
Below are the formula, a worked shift with two products, what goes wrong with a single rate, and how to read OEE per product.
Why do different products need different rated speeds?
A filler does not run a 1 litre bottle as fast as a 330 ml one. A case packer runs a 24-pack slower than a 6-pack. If the rated speed stays the same, OEE moves every time the product changes, even when the crew did nothing different.
Our guide to ideal cycle time shows how to set a rate for each product.
How do you calculate OEE per SKU?
- For each SKU: ideal time = good units / rated speed.
- Add the ideal time of all SKUs in the period.
- OEE = total ideal time / planned production time.
- Per SKU: OEE = that SKU's ideal time / the time window it had, with its own stops.
This is the count method of OEE, done product by product. Our OEE calculation guide shows the same method for one machine and two products.
What does a worked example with two products show?
Sample line (illustrative numbers, not a customer): a 450 minute shift. SKU A, a 330 ml bottle rated at 400 a minute, runs first in a 230 minute window. A changeover of 30 min follows. SKU B, a 1 litre bottle rated at 200 a minute, runs in the last 190 minutes.
| Figure | SKU A | SKU B | Shift |
|---|---|---|---|
| Window | 230 min | 190 min | 450 min |
| Good units | 60,000 | 22,000 | 82,000 |
| Ideal time | 150 min | 110 min | 260 min |
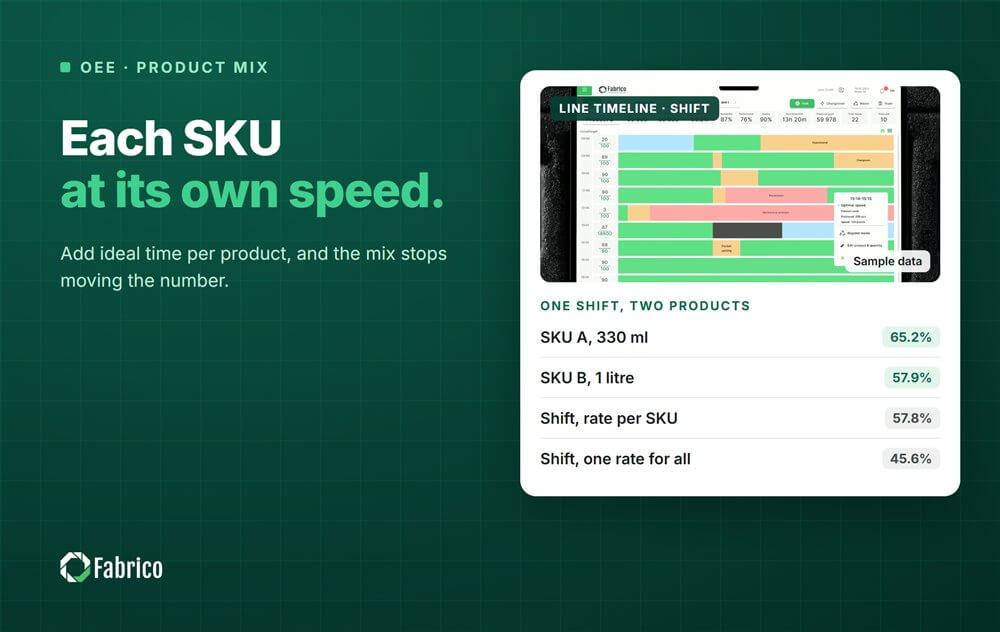
| OEE | 65.2% | 57.9% | 57.8% |
- SKU A: 60,000 / 400 = 150 minutes of ideal time, and 150 / 230 = 65.2%.
- SKU B: 22,000 / 200 = 110 minutes, and 110 / 190 = 57.9%.
- Shift: 260 / 450 = 57.8%. The changeover of 30 min counts as lost time here.
- One rate of 400 for both: 82,000 / (450 x 400 = 180,000) = 45.6%.
- One rate of 200 for both: 82,000 / (450 x 200 = 90,000) = 91.1%.
The per-SKU figures leave the changeover out, because it belongs to the switch between products. Track it on its own. Our changeover time guide covers how.
With one rate, the number moves with the mix. A week with more small bottles looks better, a week with more large bottles looks worse. Nobody can tell whether the line improved.
Where does one SKU's time window start and end?
A SKU's window starts with the first good unit after the changeover and ends with the last good unit before the next one. Everything in between belongs to that SKU, including its own stops and slow running.
- Rejects made before the first good unit belong to the changeover.
- Rejects after it count against the new SKU's Quality.
- A breakdown inside the changeover keeps its breakdown code, so it is not hidden as changeover time.
How do you use OEE per SKU?
- List every SKU with its rated speed, run windows and good units for the month.
- Rank the SKUs by OEE, then by lost output in money. A slow SKU with a small volume may cost little.
- Read the stop reasons of the worst SKUs. A product that jams the labeller shows up here.
- Bring the list to planning and sales. Some SKUs are worth keeping with a low OEE; decide it with facts.
Our article on the value of an OEE point per SKU shows how to put money on each product.
What mistakes do plants make with OEE per SKU?
- One rated speed for the whole line.
- Adding units across SKUs that run at different speeds.
- Judging a SKU on OEE alone, without its volume or margin.
- Leaving a new SKU on the rate of the product it replaced.
- Switching between changeover rules. If you charge the changeover to the incoming SKU, show it as its own line.
Where Fabrico fits
Fabrico is a computer vision enabled Manufacturing Performance Platform. OEE and light MES come first. Automatic downtime logging and OEE live by line and shift show which SKUs cost the line most.
- Losses ranked by money, so the SKUs that cost the line most stand out.
- The operator confirms the reason in one tap, so a product-specific jam gets its own code.
- OEE live by line and shift, for the daily meeting.
Read what a light MES covers in our light MES guide. You start on one line, with a baseline and a decision date agreed in advance. There is no free plan and there are no tiers: each plant gets a quote.
Frequently asked questions
How do you calculate OEE per SKU?
Turn each product's good units into ideal time with its own rated speed. Add those times and divide by the planned production time. This is the count method of OEE, done per product. It stops the product mix from moving the number when the line itself did not change.
Can I add units of different products for OEE?
Only if they all run at the same rated speed. Otherwise add ideal time, not units. In the worked example, adding units with one rate gives either 45.6% or 91.1%, while the right figure is 57.8%. The mistake can push the number up or down.
Should the changeover count against a SKU?
Count it in the shift and line OEE as lost time. In the per-SKU view, either keep it apart or charge it to the incoming product, and show it as its own line. Pick one rule and keep it, so SKUs stay comparable from month to month.
Why does my OEE change when the product mix changes?
Usually because the line uses one rated speed for every product. Weeks with more fast products look better and weeks with more slow products look worse. Give each SKU its own rate, and the mix stops moving the number on its own.
What is a good OEE per SKU?
There is no standard figure. Compare each SKU with its own past and with similar products on the same line. Then weigh it against its volume and margin. A low OEE on a small, high-margin product may matter less than a small drop on your biggest seller.
See OEE per product in a demo
Bring one line, its SKU list with rated speeds and a month of counts. We will show which products cost the line most.
Related articles








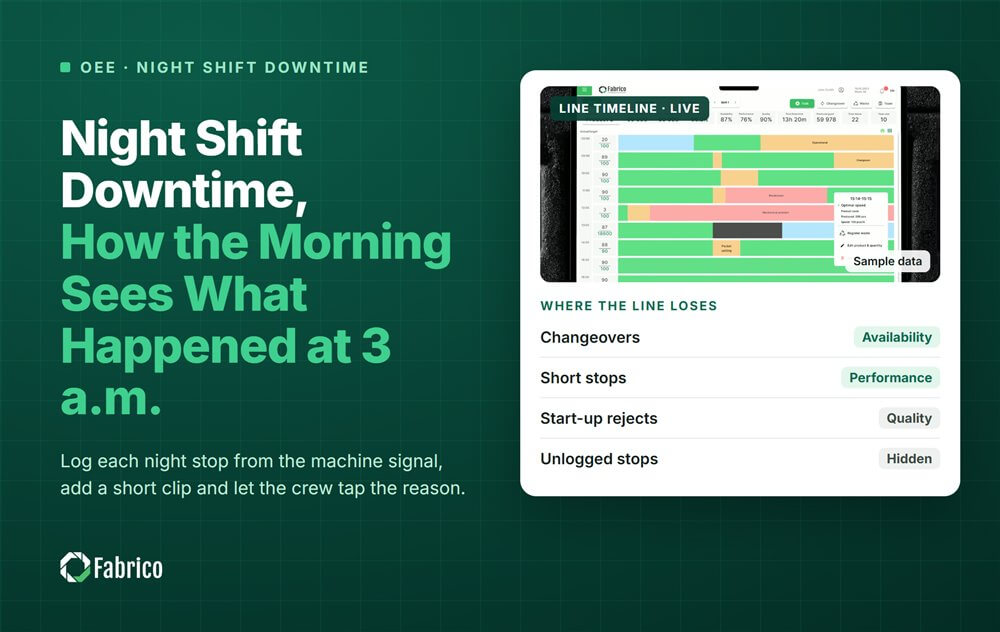


Real Fabrico tiles, sample data.