
High-speed manufacturers often realize too late that their integrated OEE software is only telling them part of the truth.
While PLCs can time stops, they cannot tell you why a stop happened, and that missing reason is where your "Hidden Factory" hides.
To achieve world-class results, you must perform a "Visibility Audit" to ensure your system captures the machine pulse, human intent, and visual truth.
See how Fabrico unifies OEE and maintenance in one platform.
Book a demoMachine data is only the baseline. PLCs tell you when a stop happened, but they rarely explain why a bottle tipped or a label jammed.
The Visibility Gap is a profit drain. Unlogged micro-stops are lost capacity that never appears in a downtime report.
Integrated Computer Vision is the final layer. Seeing the moment of a stop on video gives the team shared evidence instead of competing opinions.
The OEE Visibility Gap is the technical discrepancy between the downtime events captured by traditional machine sensors (PLCs) and the actual, frequent micro-stops and slow cycles that occur on the shop floor, which often go unrecorded because they are too short for manual logging or too complex for basic signal logic.
For a production manager, this gap is a source of constant "Post-Mortem" frustration.
They see a performance loss on a Friday report but have no data to prove if the cause was a material defect or an operator adjustment.
Fabrico narrows this gap by using the Visibility Trifecta to capture machine timing, operator context, and computer vision evidence in one real-time view.
Every OEE strategy begins with direct machine connectivity via PLC or IoT gateways.
This provides the millisecond-accurate timing required to measure Availability and Performance.
However, sensors are "Context-Blind" they cannot tell the difference between a mechanical failure and an upstream bottleneck.
Fabrico pulls this "Pulse" data and uses it as the baseline trigger for the rest of your System of Action.
The person standing at the machine often knows exactly why the line is running slow, yet their knowledge is rarely captured in a digital format.
Fabrico provides a Field-Ready mobile interface that allows operators to add context to a downtime event in seconds.
By combining machine data with human input, you move from "Data-Rich" to "Insight-Rich."
This ensures that the technician receives a work order that includes the operator's notes on material quality or environmental factors.
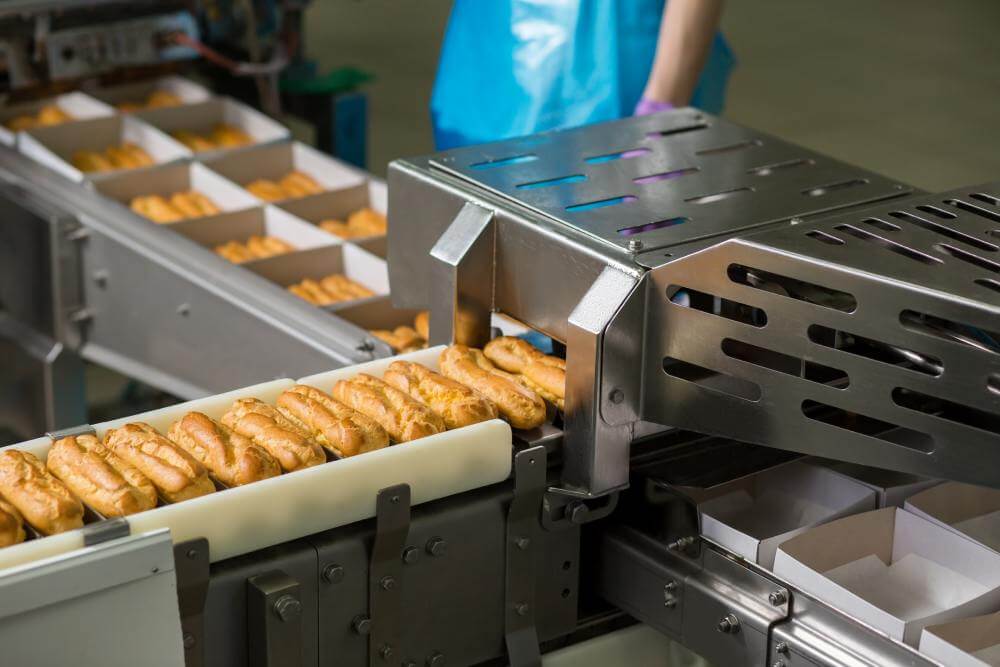
In high-speed Food & Beverage or Plastics lines, events happen too fast for humans to remember accurately.
Fabrico’s Inefficiencies Zoom-In (Computer Vision) module acts as the "Eyes" of your continuous improvement team.
When a micro-stop occurs, the system flags a short video clip of the exact moment of failure.
This visual evidence lets the production manager see if the jam was caused by a vibrating guide rail or a misaligned feeder, providing the proof needed for a permanent mechanical fix.
| Capability | Standard PLC Monitoring | Manual Operator Logs | Fabrico (System of Action) |
| Micro-stop Detection | High (Timing Only) | Zero | Timing plus video context |
| Root Cause Depth | Data-Only / Guessing | Subjective | Advanced Visual Zoom-In |
| Maintenance Link | None / Siloed | Manual Request | Native Integrated CMMS |
| Decision Latency | Moderate | Very High | Low (alerts sent as events happen) |
| Audit Readiness | Low | Low (Pencil Whipped) | Instant (Digital Trail) |
| ROI Strategy | Reporting | Compliance | Revenue Reclamation |
For a plant director, the goal of full visibility is to reduce the Maintenance Cost per Unit.
By identifying "Bad Actor" assets through the 80/20 Rule and providing visual proof of failure, they can move the team to Condition-Directed Tasks.
Ten minutes of invisible loss per shift on a three-shift line running 250 days a year is 125 hours of capacity. Multiply those hours by your contribution margin per hour to see what the gap is worth before you compare it with any software cost.
This data foundation is also what Fabrico's AI assistant draws on: it answers your team's questions using manufacturer documentation, maintenance manuals, and your real operational history.
Run the audit on one line for one week. For every shift, write down planned production time, the downtime your system logged, the total count, and the good count. Then work out what the line should have made in the time it was running.
For example, in a 480 minute shift with 45 minutes of logged stops, a filler rated at 60 units per minute has 435 minutes of run time and could make 26,100 units. If the counter shows 22,000, the missing 4,100 units equal about 68 minutes of loss that nobody logged. That unlogged time is your visibility gap, made of micro-stops and slow cycles. Repeat it for every shift and you have a measured gap instead of an estimate.
Agree on a threshold before the audit, for example any stop shorter than two minutes that the operator clears without maintenance, and apply it the same way on every line. The Six Big Losses describe minor stops as short stops, typically a minute or two, resolved by the operator. Without a fixed threshold, one shift logs a 90 second jam as downtime and another ignores it, and the audit compares definitions instead of performance.
Ask operators to add a reason only for stops above the micro-stop threshold, and give them a short pick list rather than free text. Machine signals can time every short stop on their own. People add the most value on the longer stops, where a one-tap reason turns a timestamp into something maintenance can act on.
Stop guessing your OEE. Start seeing the truth with a System of Action.
Curious what honest, real-time OEE looks like on your floor?
Watch a 15-min demo

















 Login
Login
 Blog
Blog