







 Login
 Blog
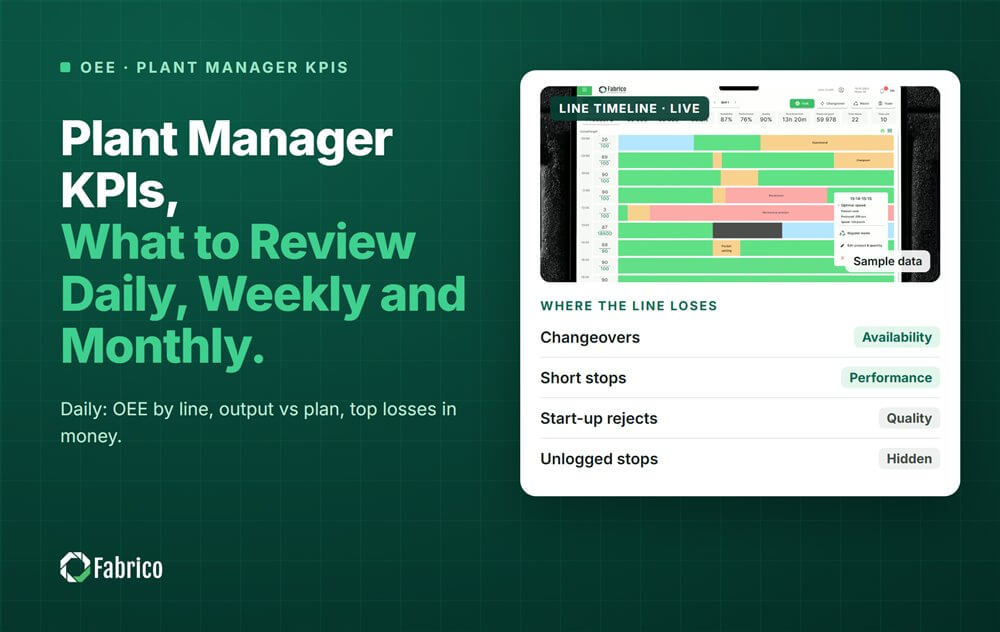
Plant Manager KPIs: What to Review Daily, Weekly and Monthly

Key takeaways
- Read 5 to 8 KPIs a day, not 30. Most belong to the shifts.
- Rank lines by the cost of their losses, not by OEE alone.
- Weight plant OEE by planned hours. A plain average can overstate it.
- Price a lost hour at contribution, in full only if the line is sold out.
A plant manager sees more numbers than anyone in the building. The job is not to read them all. It is to read a few, at the right rhythm, and ask the question that moves the plant.
Fabrico, OEE and light MES software with AI cameras, gives plant managers one view of OEE and losses by line and shift. This guide sets out which KPIs to review daily, weekly and monthly, with a worked weekly ranking.
Which KPIs should a plant manager track?
Split them by rhythm. Each rhythm answers a different question.
| Rhythm | KPIs | The question it answers |
|---|---|---|
| Daily | OEE by line and shift, output vs plan, top 3 losses in money, safety, quality holds | Where did we lose yesterday, and who is on it? |
| Weekly | OEE trend per line, losses ranked by money, changeover time vs standard, actions closed | Are the fixes working? |
| Monthly | Conversion cost per unit, capacity used, OEE vs last quarter, labor productivity | Is the plant getting better, and do we need more capacity? |
For a wider list of metrics, our guide to manufacturing KPIs covers the full family. The point here is to choose few.
What should a plant manager look at every day?
The daily page should take five minutes. It feeds the daily production meeting, not a report pack.
- OEE by line and shift, for yesterday. Look for the shift that broke the pattern.
- Output vs plan, per line. A miss you know about by 8 am can still be recovered this week.
- The top 3 losses in money, with an owner for each.
- Safety: incidents and near misses.
- Quality holds and customer complaints opened.
Our guide to the daily production meeting shows how to keep the review short and standing.
What belongs in the weekly review?
The weekly review asks if last week's actions worked. It is where trends matter more than single days.
- OEE trend per line, week on week, on the same rules.
- Losses ranked by money, not by minutes.
- Changeover time against the standard per format.
- Actions closed against actions opened.
Our page on the plant manager's weekly OEE review covers who brings what to the meeting.
Worked example: how do I rank lines for the weekly review?
Rank them by what their losses cost, not by OEE alone. A low OEE on a cheap line can matter less than a middle OEE on your best line.
Sample plant (illustrative numbers, not a customer): four lines, one week. Lost hours = planned hours x (1 minus OEE). Each lost hour is priced at the line's contribution per hour.
| Line | Planned hours | OEE | Lost hours | Contribution per hour | Cost of lost hours |
|---|---|---|---|---|---|
| A | 120 | 72% | 33.6 | $2,000 | $67,200 |
| B | 120 | 58% | 50.4 | $1,500 | $75,600 |
| C | 80 | 65% | 28.0 | $3,000 | $84,000 |
| D | 40 | 80% | 8.0 | $1,000 | $8,000 |
| Plant | 360 | 66.7% | 120.0 | $234,800 |
- Line B has the worst OEE. Line C costs the most, because each of its hours earns twice as much.
- Plant OEE, weighted by planned hours, is 240 / 360 = 66.7%.
- A plain average of the four percentages gives 68.8%. That overstates the plant, because the small line D scores best.
Two honest limits. A lost hour is worth full contribution only if the line is sold out. And not every lost hour can be won back. Agree the pricing rule with your controller once, then use it every week. In a euro plant, use contribution per hour in euros; the ranking works the same way.
What belongs in the monthly review?
The monthly review is about direction and money. It is the place for numbers that move slowly.
- Conversion cost per unit, per line or product family.
- Capacity used: planned hours against all available hours. It shows if you need a new shift or a new line.
- OEE against last quarter, to see if gains held.
- Labor productivity, such as units per labor hour.
For context on scale: Siemens' 2024 True Cost of Downtime report puts a lost hour in a large FMCG plant at USD 36,000. Your own figure will differ, so price your hours with your own contribution.
How do I compare lines and plants fairly?
Use the same definitions everywhere. What counts as planned time, what the rated speed is, and what counts as a good unit must match. Otherwise the best looking line is the one with the loosest rules.
- Weight OEE by planned time. Never average percentages.
- Keep changeovers in the loss, not in planned time.
- Compare a line with its own history first, then with other lines.
For groups with several sites, our guide to rolling up OEE across sites sets out the rules.
How many KPIs is too many?
If the daily page needs scrolling, it has too many. Five to eight numbers is a good limit for the daily view.
A KPI earns its place if someone acts on it. If a number has not changed a decision in three months, move it to the monthly pack or drop it. Our guide to OEE software for plant managers covers what the screen should show.
Where Fabrico fits
Fabrico is a computer vision enabled Manufacturing Performance Platform. OEE and light MES come first. It gives the plant manager the daily and weekly KPIs from the machines, not from typed reports.
- OEE live by line and shift, on one set of rules.
- Every loss priced in money and ranked, so the weekly review starts with the most expensive loss.
- One view across plants for groups with several sites.
You start with a pilot on one line, with a baseline and a decision date agreed in advance. There is no free plan and there are no tiers: each plant gets a quote. See how the layer fits on our light MES page.
Frequently asked questions
What KPIs does a plant manager track?
A plant manager tracks OEE by line and shift, output against plan, the top losses in money, safety and quality holds every day. Each week, the trend per line and actions closed. Each month, conversion cost per unit, capacity used and progress against last quarter.
What is the most important KPI for a plant manager?
There is no single one, but OEE by line with its losses priced in money comes close. It joins availability, speed and quality in one number, and the money ranking shows which loss to fix first. Safety always sits next to it, and never behind it.
How often should plant KPIs be reviewed?
Shift numbers every day, in a short standing meeting. Trends and actions once a week. Cost, capacity and quarter on quarter progress once a month. Each rhythm has its own short page, so nobody reads monthly numbers every morning or daily noise once a month.
How do I calculate plant OEE from several lines?
Weight each line by its planned time. Multiply each line's OEE by its planned hours, add the results, then divide by total planned hours. Four lines with 360 planned hours and 240 weighted hours give 66.7%. A plain average of percentages gives the wrong answer.
Should a plant manager see shift level data?
Yes, by line and shift, but not as a ranking of named people. Shift data shows where a pattern breaks, such as a weak first hour or a long night changeover. That points to a process to fix, which is the plant manager's job.
Bring one week of line data to a Fabrico demo. We will rank your losses by money, or contact us with a question.
Latest from our blog


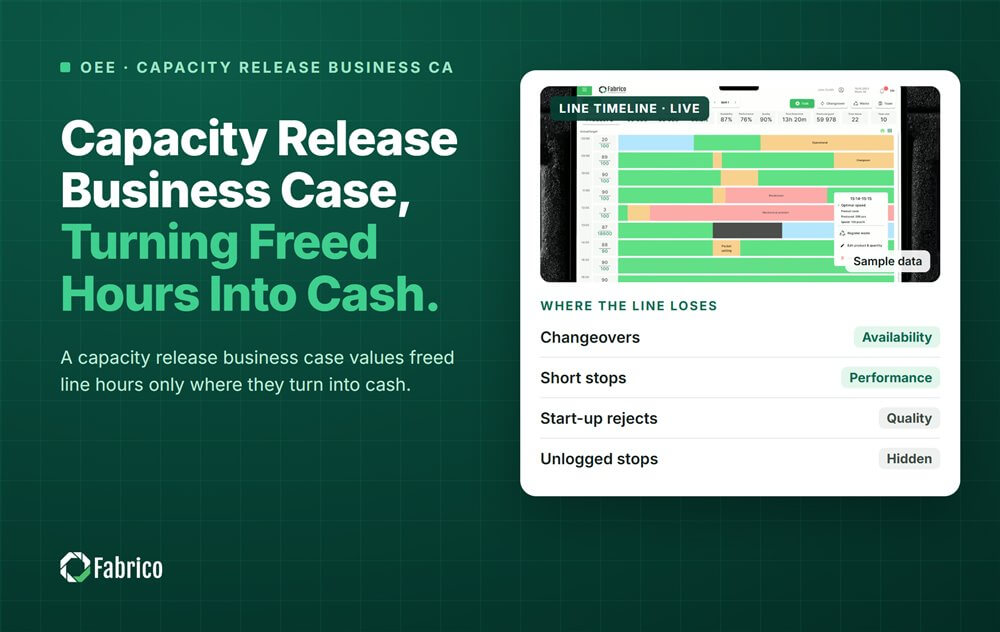


Real Fabrico tiles, sample data.