


 Login
 Blog
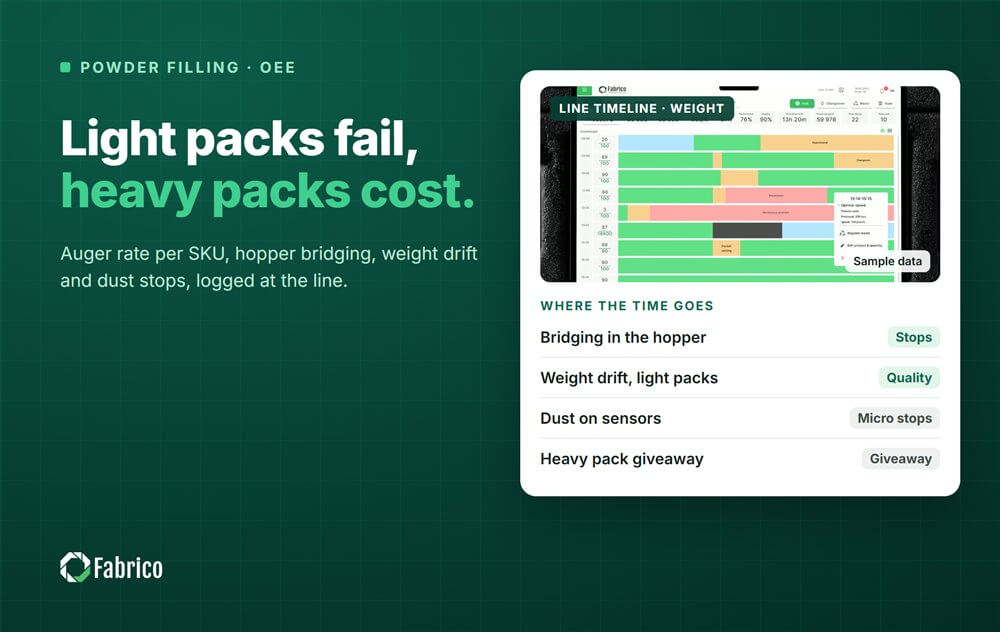
Powder Filling Line OEE: Auger Fillers, Weight Control and Cleaning

Key takeaways
- Set the ideal rate per SKU: product, fill weight and container all change how fast an auger can fill.
- Light packs rejected at the checkweigher are a Quality loss. Heavy packs pass as good and give product away, which OEE does not show.
- Powder flow changes with every batch. Bridging in the hopper and weight drift are the stops and rejects to watch.
- Dust causes false stops at sensors and leaking seals. They are short, frequent and rarely logged.
- A validated allergen clean is never shortened. The time to win is before and after it.
The checkweigher has rejected forty jars in ten minutes, all light. The new batch of powder came in fluffier than the last one, the auger turns the same number of revolutions, and each jar holds a few grams less. Nobody stopped the line, OEE Quality is sliding, and when someone adds turns to the auger the line will swing the other way into giveaway.
Powder lines for milk powder, coffee, cocoa, spices and detergent share one problem: the product does not behave the same way twice. Flow, density and dust change with the batch, the humidity and the level in the hopper, and the line's losses follow. This guide covers where the time goes, the ideal rate, weight control, dust, the typical stops, changeovers and cleaning, data sources and a worked shift.
Where the time goes on a powder filling line
Containers come in on the infeed: cans, jars, or bags formed on a vertical form fill seal machine. The auger filler sits under a hopper with an agitator, and a servo turns the auger a set number of revolutions for each fill. Some lines fill in two stages, a bulk fill then a weighed top-up. Milk powder cans are often flushed with nitrogen before seaming; jars are capped and induction sealed. A checkweigher follows, then the labeller and the case packer, with dust extraction along the way.
The time goes to a few places: powder that bridges in the hopper and stops flowing, augers and funnels that build up, false stops from dust on sensors, seamer and capper jams, weight drift that sends packs to reject, and changeovers with their cleaning.

The ideal rate per SKU
An auger fills by volume, so a heavier fill takes more revolutions and more time. A free-flowing granulated coffee fills faster than a sticky, fine milk powder. One ideal rate for the whole line will flatter some SKUs and punish others.
Set the ideal per SKU: product, fill weight and container. Take the OEM rating for that combination, or the best speed the line holds for a full hour on it, and keep it under change control. If Performance reads above its maximum on a SKU, its ideal is too low.
Weight control: rejects and giveaway
Fill weight drifts because bulk density drifts. A new batch, a change in humidity, a fuller or emptier hopper, or powder that has been aerated by the agitator all change how many grams one revolution delivers. The checkweigher catches the result and, on most lines, feeds a correction back to the filler.
Light packs go to reject, and each one counts against Quality. Heavy packs pass as good: OEE says nothing, but the plant is giving product away. That is why many plants run the target a little above the declared weight and argue about how much. Set the target against the measured variation of each SKU, not a guess. Our article on giveaway and overfill covers how to price it, and our guide to the OEE Quality factor explains what counts as good.
Dust: the loss nobody writes down
Dust settles on photo eyes and proximity sensors, and the machine stops because it thinks a container is missing or out of place. The operator wipes the sensor and restarts. Each stop is a few seconds to a minute, too short for the paper log, and on a dusty product they come every few minutes.
Dust in the seal area causes leaking bags and poor induction seals. Dust on a can rim can cause seaming faults. All of these land in Performance or Quality, and none of them looks like a breakdown. Count them as their own codes. Our guide to micro stops in manufacturing explains how to set the cutoff between a short stop and downtime.
Typical stops and their causes
| Station | Typical stop or loss | Usual cause | OEE factor |
|---|---|---|---|
| Hopper and agitator | No flow, low level | Bridging or rat-holing, late refill | Availability |
| Auger and funnel | Weight drift, drips of powder after the fill | Build-up on the auger, wrong tooling for the fill weight | Quality, Performance |
| Container infeed | False stops, jams | Dust on sensors, damaged containers | Performance |
| Seamer or capper | Jam, seam or seal fault | Dust on the rim, lid or cap feed, set-up | Availability, Quality |
| Checkweigher | Rejects | Light fills, density change | Quality |
| Case packer | Outfeed full | Downstream stop | Availability, charged downstream |
Changeovers and cleaning
A changeover on a powder line can mean three different jobs. A fill weight change may need a different auger and funnel. A container change swaps format parts on the infeed, the filler and the seamer or capper. A product change means emptying the hopper and the auger and cleaning the product path.
Cleaning is where the time goes. A dry clean, with vacuum and brushes, is faster than a wet clean that needs drying before the line can run. Where an allergen sits between two products, such as milk powder followed by a product without milk, the clean is the validated clean. It is never shortened to win OEE minutes. The time to win is around it: tools and parts staged before the line stops, the next product ready at the hopper, and a fast, clean restart. Our guides to allergen changeover validation and changeover time go further.
Count each changeover from the last good pack to the first good pack at rated speed, keep the clean as its own step inside it, and set a standard per type of change.
What each data source sees
- The PLC gives the filler's state, alarms and fill count.
- The checkweigher gives every weight, the rejects and the average, which is where giveaway shows.
- A camera over the infeed, the filler outlet or the seamer shows what an alarm cannot: a container standing crooked, powder spilling over a rim, a jam at the lid feed. It does not see inside the hopper. The clip is the evidence for the stop.
- The operator confirms the reason from a short list of codes.
A worked shift on a jar line
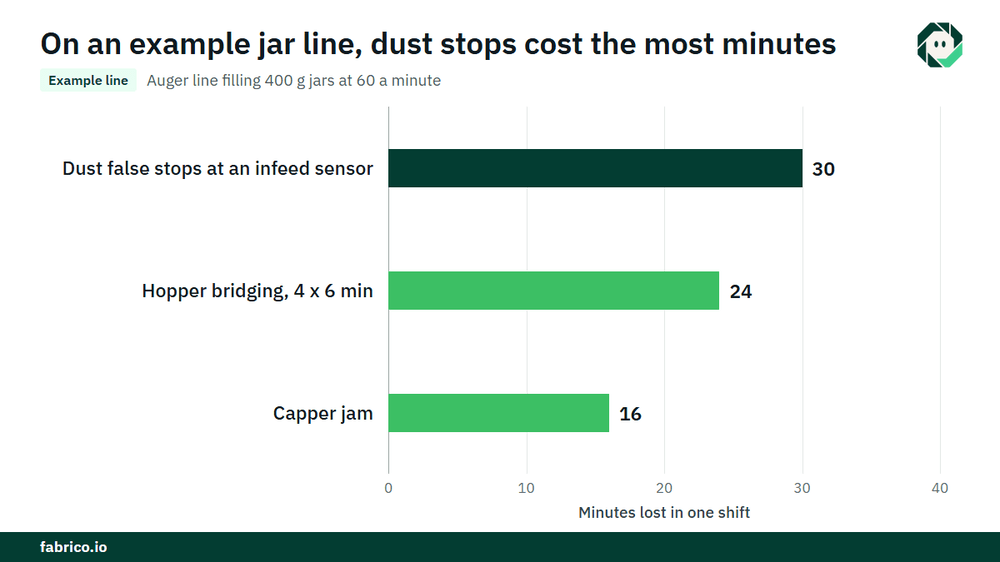
Sample line (illustrative numbers, not a customer): an auger line filling 400 g jars with an ideal rate of 60 jars a minute for this SKU. The shift has 450 minutes of planned production time, so 450 x 60 = 27,000 jars are possible. Stops above the 2-minute cutoff: four hopper bridging stops of 6 minutes (24) and a capper jam (16), 40 minutes in all. Run time is 410 minutes, so Availability = 410 / 450 = 91.1%.
At 60 a minute, 410 minutes should give 24,600 jars. The counter shows 22,800, so Performance = 22,800 / 24,600 = 92.7%. The 1,800 missing jars are 30 minutes at full rate, and the stop log shows 40 false stops from dust on an infeed sensor, about 45 seconds each.
The checkweigher and the seal check reject 456 jars, so the good count is 22,344 and Quality = 22,344 / 22,800 = 98.0%. OEE = 0.911 x 0.927 x 0.980 = 82.8%. Check: 22,344 good jars out of 27,000 possible is 82.8%.
Price it. At a contribution of $0.80 a jar, €0.80 in a euro plant, the dust stops cost 1,800 x $0.80 = $1,440, or €1,440. Then the giveaway: the average fill was 403 g on a 400 g target, so 3 g x 22,344 good jars = 67,032 g, about 67 kg. At $6.00 a kg, €6.00 in a euro plant, that is about $402, or €402, of product given away this shift, while Quality read 98.0% the whole time.
Where Fabrico fits
Fabrico is a computer vision enabled Manufacturing Performance Platform. On a powder line it starts with OEE and light MES: automatic downtime logging from the machine signal and OEE live by line and shift, so the short dust stops are recorded with the long bridging stops.
The operator confirms the reason in one tap, so a false stop from a dirty sensor gets its own code. Where a camera watches the infeed or the seamer, a camera clip is kept as evidence for a stop. The camera suggests the reason, the operator decides.
Losses are priced in money and ranked by money, so the dust stops, the bridging and the changeovers each carry a figure. A breakdown becomes a work order to the right technician with its cost. One view across plants compares the same SKU on different lines, and you start on one line with a decision date agreed in advance.
Each plant gets a quote after a review of its lines.
Frequently asked questions
How do you calculate OEE on a powder filling line?
Set the ideal rate per SKU. Availability is run time over planned production time, Performance is the fill count over run time times the ideal rate, and Quality is good packs over all packs. Multiply the three.
Does giveaway count in OEE?
No. An overfilled pack passes as good, so OEE Quality does not see it. Track giveaway from the checkweigher average and price it in money next to OEE.
Why does auger fill weight drift?
Because the auger fills by volume and powder density changes with the batch, the humidity, the hopper level and aeration. Checkweigher feedback corrects part of it; build-up on the auger and the wrong tooling cause the rest.
How do you shorten cleaning on a powder line?
Not by cutting a validated clean. Stage tools and parts before the stop, prepare the next product, and plan the order of products so fewer allergen cleans are needed. Then measure the restart to the first good pack.
Should cleaning count as planned downtime?
Whatever rule you pick, set a standard time per clean and treat every minute over it as a loss with a reason. Otherwise overruns hide in the planned bucket.
See your powder line's losses in a demo
Bring one shift of filler and checkweigher data. We will show where the stops, rejects and giveaway sit and what each costs.








Real Fabrico tiles, sample data.