Login
 Blog
Shift Production Report: What to Include, With a Template

Key takeaways
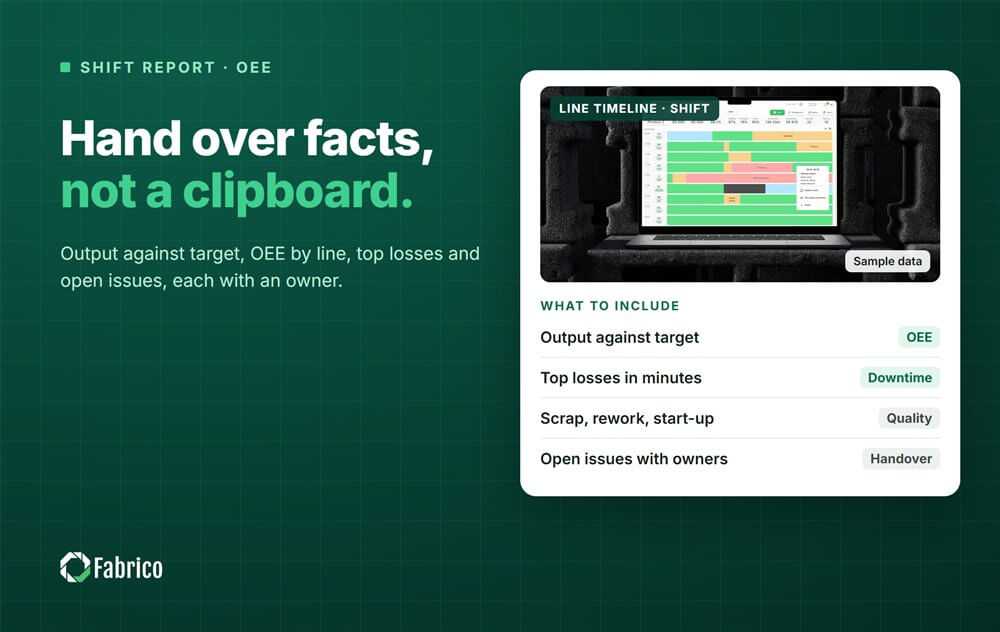
- A shift production report answers four questions: what did we make, against what target, where did the time go, and what is still open.
- Put output against target and OEE by line at the top, then the top three losses in minutes and in money.
- Quality sits on the same page: good count, scrap, rework and startup rejects after a changeover.
- Every open issue carries an owner and a next step, or the next shift inherits it blind.
- Fill the report from machine counts and stops, with the operator confirming each reason at the line, instead of rebuilding the shift from a clipboard at ten to six.
It is ten to six on line 2. The night supervisor copies the case packer counter onto a form, adds up the stop sheet and finds a gap: the sheet explains 50 minutes of stops, but the count is far below what 400 minutes of running should give, and nobody can say where the rest of the shift went. The OEE figure that reaches the morning meeting is a calculation built on a guess.
A shift production report should close that gap. It is the one page that tells the next shift, the production manager and the plant manager what the line made, what it should have made, which losses cost the most and what is still open.
This guide covers what to put in the report, a table template, how to set the target, how to price the losses and how to fill the page from machine data.
What a shift production report is for
Three people read it. The incoming shift leader wants to know what state the line is in: which machine is fragile and which material is short. The production manager wants the gap against target and the top losses, ready for the tier 1 meeting. The plant manager wants the trend and the money.
One page can serve all three if it keeps a fixed order: numbers first, losses second, open issues last. A report that lists forty stop entries in time order is a log, not a report.

The shift production report template
These seven blocks cover a shift on one page. Keep the same order on every line and shift.
| Block | What goes in it | Where the number comes from |
|---|---|---|
| 1. Header | Line, shift, date, shift leader, products run, planned production time | Shift plan |
| 2. Output against target | Target good count, actual good count, gap in units and in minutes at ideal rate | Machine counter or PLC count; target from the plan |
| 3. OEE by line | Availability, Performance, Quality and OEE, with the minutes behind each factor | Run time, stop time and counts |
| 4. Top losses | The three largest losses: minutes, occurrences, money, confirmed reason | Logged stops with reasons |
| 5. Quality | Good count, scrap, rework, startup rejects, product on hold | Reject counter and QC records |
| 6. Open issues | Problem, owner, next step, status, due by which shift | Shift leader |
| 7. Handover notes | Material, changeovers coming, machine condition, points for the next board meeting | Shift leader and operators |
Block 2 should match the last row of the hour by hour production board at the line, if you run one.
Output against target: fix the target before the shift
The gap only means something if the target was set before the shift began. Two rules work. The first takes the ideal rate times the planned production time, so the gap is the full loss. The second applies a planned OEE to that figure, so the target is what a normal shift should reach.
Whichever rule you choose, write it on the report and keep it. A target lowered after a bad night turns a loss into a met target and hides it. Show the gap in units and in minutes at ideal rate, so it adds up with the stop minutes.
OEE by line, with the minutes behind it
OEE is Availability x Performance x Quality. On a shift report each factor should carry its minutes, because a percentage alone gives nobody anything to fix. Availability is run time over planned production time. Performance is ideal cycle time times total count over run time. Quality is good count over total count.
The definitions decide the number, so agree them once: what counts as planned time, which ideal rate each product uses, and the length below which a stop counts as a minor stop rather than downtime.
Sample line (illustrative numbers, not a customer): a packing line runs a shift of 480 minutes with a 30 minute break, so planned production time is 450 minutes. The ideal rate is 100 packs a minute. Logged stops add up to 50 minutes, so run time is 400 minutes. The line counts 36,000 packs, of which 900 are rejects.
- Availability = 400 / 450 = 88.9%
- Performance: 36,000 packs at ideal rate need 360 minutes, and 360 / 400 = 90.0%
- Quality = 35,100 good / 36,000 = 97.5%
- OEE = 0.889 x 0.900 x 0.975 = 78.0%
- Check: 35,100 good packs need 351 minutes at ideal rate, and 351 / 450 = 78.0%
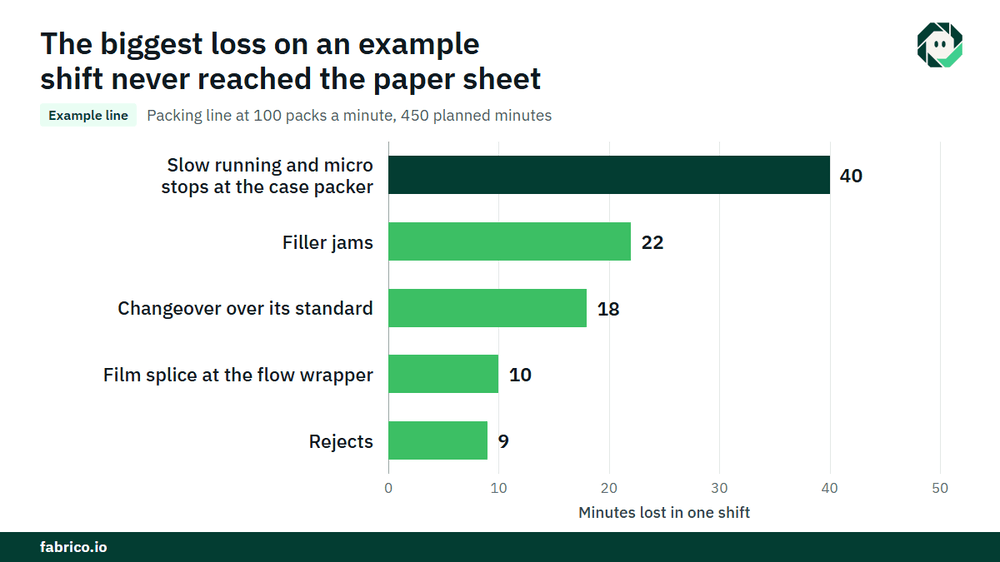
The target was set at a planned OEE of 82%: 450 minutes x 100 packs x 0.82 = 36,900 good packs. The line made 35,100, a gap of 1,800 packs, or 18 minutes at ideal rate. The 99 lost minutes split into 50 minutes of stops, 40 minutes of slow running and micro stops (400 minus 360) and 9 minutes of rejects (360 minus 351).
Top losses in minutes and in money
List the three largest losses, not all of them. For each, give the minutes, how many times it happened and the reason the operator confirmed. Then price it, because 22 minutes on the filler and 22 minutes on a labeller with a full buffer in front of it do not cost the same.
Price a lost minute at the contribution margin of the constraint when the plant can sell what it makes, and at the recovery cost when it can catch up inside the normal plan. Our guide to contribution margin per line hour shows how to agree that number with your controller.
Sample line (continued, illustrative): the line is the constraint and sold out, and each pack carries $0.12 of contribution, €0.12 in a euro plant. One minute at ideal rate is 100 packs, so a lost minute is worth $12 (€12).
| Loss | Minutes | Occurrences | Money |
|---|---|---|---|
| Slow running and micro stops at the case packer | 40 | Not on the paper sheet | 40 x $12 = $480 (€480) |
| Filler jams | 22 | 6 | 22 x $12 = $264 (€264) |
| Changeover over its standard | 18 | 1 | 18 x $12 = $216 (€216) |
| Film splice at the flow wrapper | 10 | 4 | 10 x $12 = $120 (€120) |
| Rejects | 9 | 900 packs | 9 x $12 = $108 (€108), plus material |
The stops add up to the 50 logged minutes (22 + 18 + 10), and the whole shift lost 99 minutes, worth $1,188 (€1,188). The largest single loss is the one the paper sheet never showed: 40 minutes of short stops and slow running, worth $480 (€480). Ranked by money, it goes to the top of the report.
Quality on the shift report
Quality is where shift reports drift most often. Rework counted as good, startup rejects thrown away before anyone counts them and product on hold left out of the total all flatter the figure.
Count good first time, scrap, rework and product on hold, and give startup rejects after a changeover their own row, because they belong to the changeover. Rework is not good count in OEE, even if it ships in the end.
Open issues and the handover
The last block is the one the next shift actually reads. Each open issue needs four fields: the problem, the owner, the next step and when it is due. Filler starwheel worn, technician called, part arrives at 10:00 is a handover. Filler problems is not.
Keep open issues on the report until they are closed, so the trail stays visible. A structured shift handover checklist helps the outgoing leader cover material, coming changeovers and machine condition.
From clipboard to machine data: automating the report
A report filled by hand at shift end has three weak points: copied counts carry typos, remembered stops lose the short ones, and reasons picked to close the form grow the other bucket. Take each number from the source closest to the machine instead.
| Number | Clipboard source | Machine data source |
|---|---|---|
| Total and good count | Counter read at shift end | PLC or counter signal, reject counter |
| Stop start and length | Operator memory | Machine state from the PLC or a sensor |
| Stop reason | Written later | Operator confirms at the line, in one tap |
| What happened at the stop | Nobody knows | A camera clip, where a camera watches the station |
| Money per loss | Not on the form | Minutes times the agreed value per minute |
With those sources the report builds itself at shift end, and the supervisor spends the last ten minutes on open issues instead of arithmetic. The difference between a live view and a report assembled after the fact is covered in real-time OEE vs end of shift reporting.
Mistakes that make shift reports useless
- Other as the top reason. If other leads the losses, the reason list needs work, not the operators.
- Shift against shift as a contest. Comparing shifts helps when it finds a process difference, such as a changeover routine or a material lot. It hurts when it turns into a ranking of people. Our shift comparison method keeps the comparison on the process.
Where Fabrico fits
Fabrico is a computer vision enabled Manufacturing Performance Platform. For the shift report, that means OEE and light MES first: OEE live by line and shift, with the minutes behind each factor, and automatic downtime logging from the machine signal, so the stop sheet is no longer rebuilt from memory.
The operator confirms the reason in one tap at the line, and where a camera watches the station, a camera clip is kept as evidence for a stop. Losses are priced in money and ranked by money, so the top three on the report are the three that cost most, not the three someone remembered. When a stop is a breakdown, a work order goes to the right technician with its cost. Plants with several sites get one view across plants, and you can start on one line.
Each plant gets a quote after a review of its lines.
Frequently asked questions
What should be included in a shift production report?
Line, shift and planned time; output against target; OEE by line with its minutes; the top three losses in minutes and money; quality counts; open issues with owners; and handover notes for the next shift.
How do you calculate the production target for a shift?
Multiply the ideal rate by the planned production time to get the most the line could make. Many plants then apply a planned OEE to set a realistic target. Fix the rule before the shift starts and do not change it afterwards.
Can a shift production report be automated?
Yes. Counts come from the PLC or a counter, stops are logged from the machine state, the operator confirms the reason at the line, and the report is produced at shift end. The supervisor then adds only the open issues and the handover notes.
Should a shift report compare shifts?
It can show the trend by shift, which helps find process differences such as a changeover routine or a material lot. It should not rank people. Measure the process, never the person.
See your shift report built from machine data
Bring one line and last week's shift reports to a demo. We will show what the same shifts look like with automatic stops, confirmed reasons and losses priced in money.
Latest from our blog