


 Login
 Blog
Cycle Time in Manufacturing: Definition, Formula and Examples

TL;DR
Cycle time is the actual time it takes to produce one unit while a process is running, calculated as net production time divided by the number of units made. It excludes downtime and planned stops, and the gap between ideal and actual cycle time is the speed loss that directly lowers the Performance factor of OEE.
- Cycle time = net production time divided by the number of units produced, giving the actual seconds or minutes spent making one unit while the line is running.
- Ideal cycle time is the fastest sustainable time per part; the gap between ideal and actual cycle time is pure speed loss and feeds the Performance factor of OEE.
- Cycle time is what you control on the floor, takt time is the demand-driven target, and lead time is the full order-to-delivery clock.
- Real-time PLC capture of cycle time flags drift the moment it happens, instead of surfacing slow cycles days later in a spreadsheet.
What is cycle time in manufacturing?
Cycle time is the actual measured time it takes to produce one unit while the process is running. It is the heartbeat of a production line.
If a packaging machine completes one carton every 2.4 seconds, its cycle time is 2.4 seconds per unit. Crucially, cycle time only counts the time the equipment is actively running, so it excludes breakdowns, changeovers, and planned stops.
This is what makes cycle time different from broader timing metrics. It is a pure measure of process speed, not order fulfillment or scheduling. When cycle time drifts upward, your line is quietly making fewer parts per hour even when nothing has visibly broken, which is exactly why it is one of the most useful and most overlooked numbers on the floor.
Cycle times help only when they are measured on every shift. OEE monitoring lets a plant compare cycle time across shifts without sending someone out with a stopwatch. A light MES reads them from the machine signal and sets each cycle against the ideal cycle time.
How do you calculate cycle time? The formula
The core formula is net production time divided by the number of units produced.
Cycle Time = Net Production Time / Number of Units Produced
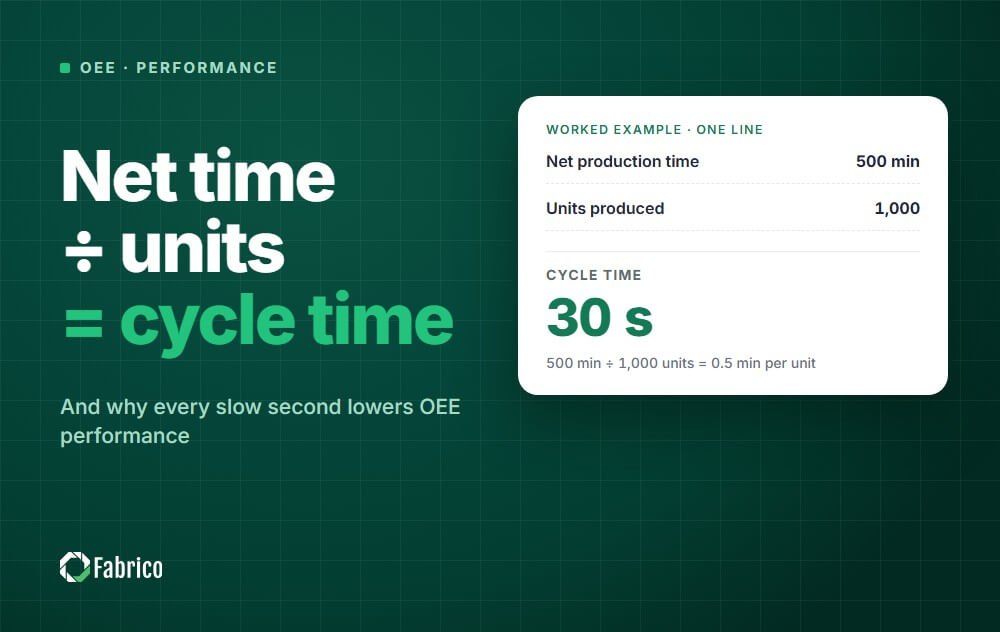
"Net production time" means the time the machine was actually running, with stops removed. If a line runs for 500 minutes of net production time and produces 1,000 units, the cycle time is 500 / 1,000 = 0.5 minutes, or 30 seconds per unit. This is the aggregate view, and it is the easiest to pull from production logs.
There is also a per-unit observed view, where you time individual cycles directly with a stopwatch or, more reliably, by reading the machine signal each time a part completes. The observed view exposes variation that the aggregate average hides: ten fast cycles and one very slow cycle can produce a healthy-looking average while masking a recurring stall.
How to run a cycle time observation study
Where there is no machine signal, time the cycles by hand and work out two numbers: the average and the standard deviation.
- Define the cycle. Write down where one cycle starts and ends, for one machine, one product and one method.
- Time cycles in a row. Record 10 to 30 consecutive cycles, more when they vary a lot, and note anything unusual such as a jam or a material change.
- Work out the average. Add up the timed cycles and divide by the number of cycles.
- Work out the standard deviation. It shows how far a typical cycle sits from the average. A large one points to short stops or differences in method.
- Look again at the outliers. A cycle far from the average, for example more than two standard deviations away, is often a short stop or a one-off event, not normal variation.
Store each observation with the same fields: date and shift, machine, product, method or operator, cycle number, start time, end time, cycle time and a note. Our time study data model lists the fields, ratings and allowances in full.
Ideal cycle time vs actual cycle time
Ideal cycle time is the fastest time per part your process can achieve on a sustained basis; actual cycle time is what it really achieves while running.
According to OEE.com, ideal cycle time is "the absolute fastest time per part that can be achieved by your manufacturing process on a sustained basis," while cycle time is "the actual measured time per part achieved by your manufacturing process while it is running."
The difference between the two is speed loss. You can quantify it directly:
Cycle Time Loss = Run Time - (Total Units x Ideal Cycle Time)
If actual cycle time ever appears faster than ideal, the ideal cycle time has been set wrong, usually overstated, and every downstream calculation built on it will be inaccurate. The ideal cycle time should come from the equipment manufacturer's rated speed or your best validated sustained run, not a hopeful guess. Ideal cycle time is also the input that sets the Performance factor in the OEE formula, so a wrong value moves OEE as well.
| Term | What it measures | Set by | You control it? |
|---|---|---|---|
| Cycle time | Actual seconds/minutes to make one unit while running | Your process capability | Yes |
| Ideal cycle time | Fastest sustainable time per unit | Equipment rating | Benchmark only |
| Takt time | Required pace to meet customer demand | The market / orders | No |
| Lead time | Order placed to order delivered | Whole value stream | Indirectly |
Cycle time for a line, and cycle time in units per hour
For a line of machines in series, the line's cycle time is set by its slowest step, the bottleneck. Adding up the step times gives the time one unit spends being processed, which is a different number.
As an illustration, if four stations take 40, 55, 35 and 30 seconds per unit, a finished unit leaves the full line every 55 seconds, while each unit spends 160 seconds being processed. Our guide to bottleneck analysis shows how to find the slowest step.
To turn cycle time into an output rate, divide the time period by the cycle time: 3,600 seconds per hour ÷ 30 seconds per unit = 120 units per hour while the line runs. The other way round, 60 minutes ÷ 120 units = 0.5 minutes per unit.
Is a lower cycle time always better? Only if quality holds and the extra output is needed. A machine pushed past its validated speed tends to make more defects, and a step before the bottleneck that runs faster only builds stock in front of the bottleneck, and a faster step after it only waits.
Cycle time vs takt time vs lead time: what is the difference?
Cycle time is the pace you actually hit, takt time is the pace you need to hit, and lead time is the total clock from order to delivery. These three are constantly confused, but they answer different questions.
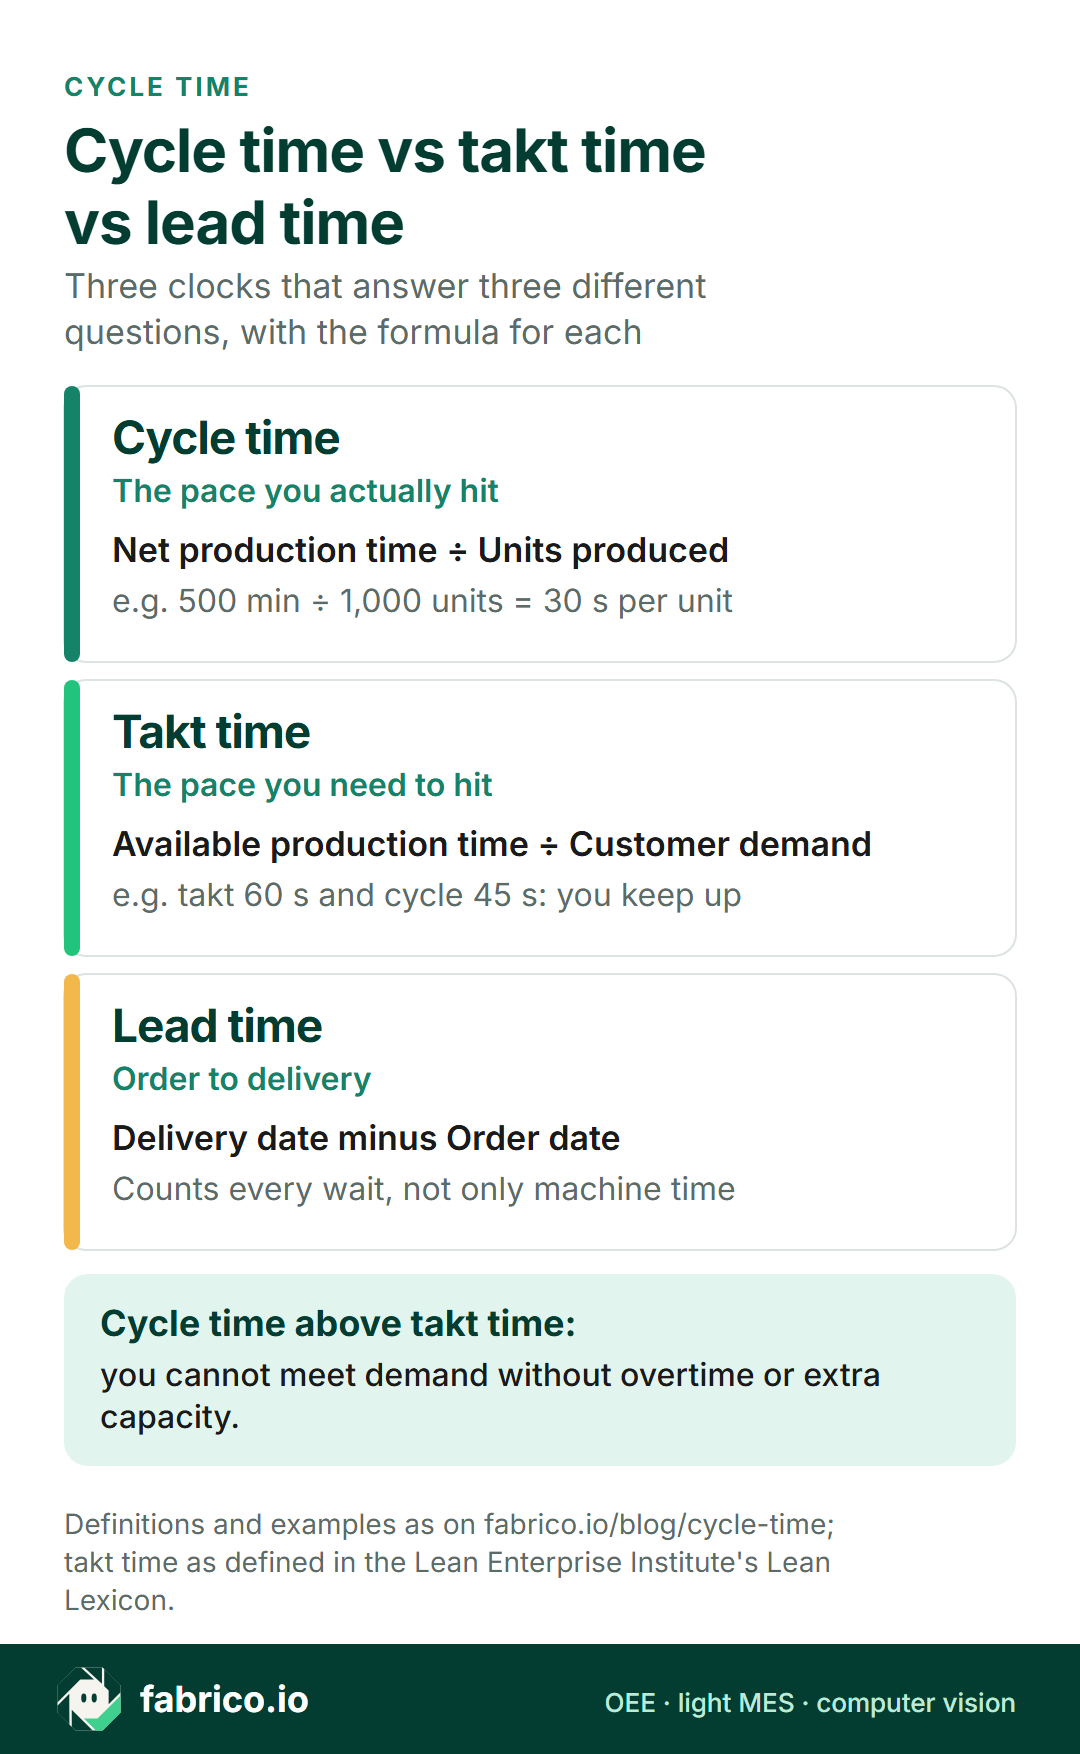
Takt time is available production time divided by customer demand. It is the ceiling: if takt time is 60 seconds and your cycle time is 45 seconds, you are comfortably keeping up with demand. If cycle time climbs above takt time, you cannot meet orders without overtime or extra capacity.
Lead time is the longest of the three because it includes queueing, batching, and waiting, all the value-added and non-value-added time a customer experiences.
The healthy relationship is simple: cycle time should sit comfortably below takt time, and reducing cycle time creates the headroom that shortens lead time. We cover the demand-pacing side in depth in our guide to capacity utilization rate, so this article stays focused on the speed metric you directly own.
Slow cycles are one of the losses nobody writes down. Why Lines Stop, our free field guide, shows how to put a price on the time a line loses, starting with one stopped hour.
How does cycle time drive the Performance factor of OEE?
Cycle time is the entire engine behind the Performance factor of Overall Equipment Effectiveness. OEE has three factors, Availability, Performance, and Quality, and Performance is where every slow cycle and small stop shows up. The formula from OEE.com is:
Performance = (Ideal Cycle Time x Total Count) / Run Time
In other words, Performance compares how fast you could have run (ideal cycle time times every unit made) against how long the line was actually running. When actual cycle time creeps above ideal, the numerator shrinks relative to the denominator and Performance falls. This is why cycle time drift is so financially dangerous: it erodes OEE silently, without ever triggering a downtime alarm.
If you are building or auditing your OEE program, start with our complete guide to OEE and the step-by-step OEE calculation walkthrough. Slow cycles and small stops also map directly onto the six big losses framework, which categorizes exactly the speed losses cycle time exposes.
A worked example
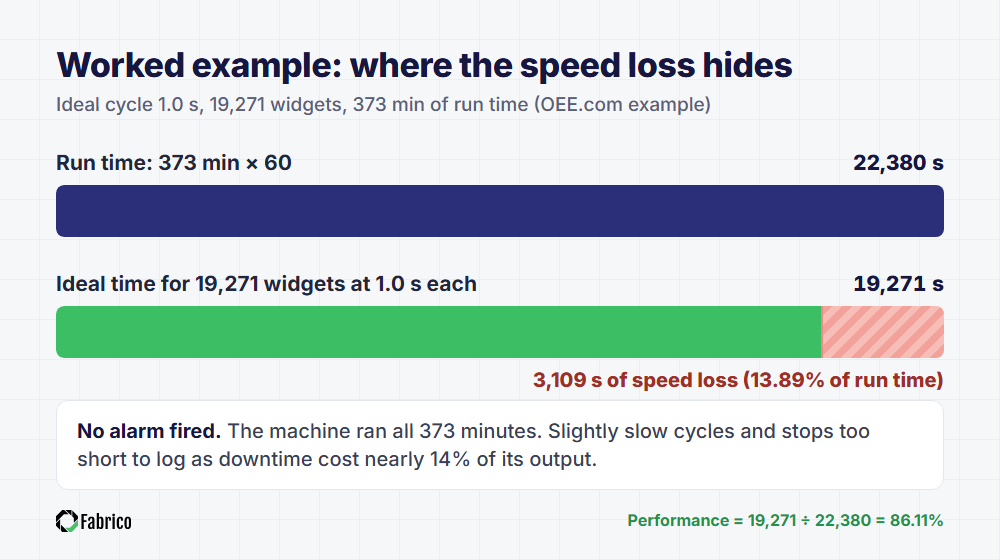
OEE.com's worked example makes the link concrete. With an ideal cycle time of 1.0 seconds, a total count of 19,271 widgets, and a run time of 373 minutes, Performance calculates as:
(1.0 second x 19,271 widgets) / (373 minutes x 60 seconds) = 0.8611, or 86.11%
That 13.89% gap is entirely speed loss. The machine ran the whole 373 minutes, but the cumulative effect of cycles running slightly slow, plus small stops too brief to log as downtime, cost nearly 14% of the line's potential output.
No alarm fired. That is the trap cycle time monitoring is built to close.
What does downtime cost you? Enter your line rate, stops and rejects in the OEE calculator to get OEE and the cost of the loss.
What are practical ways to reduce cycle time?
The fastest gains come from eliminating micro-stops and slow cycles, not from running equipment harder. Use this checklist as a starting point:
- Measure the per-unit cycle, not just the shift average. Averages hide the recurring slow cycle that is dragging you down.
- Hunt small stops. Jams, misfeeds, and momentary sensor faults each last seconds but compound into the largest Performance loss on most lines.
- Validate the ideal cycle time. A wrong benchmark makes every target meaningless. Confirm it against equipment ratings.
- Reduce changeover variation with SMED so the line returns to ideal speed faster after each setup.
- Standardize operator method. Cycle time variation between shifts is almost always a method-and-training gap.
- Attack tooling and lubrication drift early, since worn tooling slows cycles long before it causes a hard stop. Catching that pattern is exactly what an effective preventive maintenance program is for.
The common thread is visibility. Cycle time drift is invisible to the human eye because each lost fraction of a second is too small to notice. It only becomes visible when you measure every cycle and compare it to the ideal in real time.
How does Fabrico capture cycle time in real time?
Fabrico reads cycle times directly from machine PLCs, so drift surfaces the instant it starts rather than days later in a spreadsheet. Because Fabrico connects to the controller, it sees each completed part and the actual time it took, then compares that against the ideal cycle time automatically.
When cycles begin running slow, the Performance factor moves on the live dashboard straight away, instead of surfacing in a monthly report. That cycle data feeds Fabrico's OEE software, which shows OEE live by line, machine and shift.
This matters because cycle time loss is a maintenance and process problem disguised as a speed problem.
When Fabrico's live cycle data shows a slowdown, the operator tags the cause on a tablet and a technician can open a digital work order for that machine on a phone, taking a slow cycle through to a confirmed fix.
Tying real-time cycle data to the repair work is how a plant stops silent speed loss from quietly eroding OEE. Fabrico is built in the EU, and EU clients are hosted in the AWS EU region, with EU data residency.
To see real-time cycle time capture and the work order flow on a demonstration plant with lines like yours, book a demo.
Setting the standard behind that cycle time? Our time study data model covers the observation sheet fields, ratings and allowances.
Slow cycles are the performance loss in OEE. The cost of downtime calculator puts a yearly price on the gap between your current OEE and the OEE you could reach.
Frequently asked questions
What is the formula for cycle time?
The core formula is net production time divided by the number of units produced. If a line runs 500 minutes of net production time and makes 1,000 units, cycle time is 500 / 1,000 = 0.5 minutes, or 30 seconds per unit. Net production time excludes downtime and planned stops, so cycle time reflects only the speed of the process while it is actively running.
What is the difference between ideal and actual cycle time?
Ideal cycle time is the fastest time per part your process can achieve on a sustained basis, usually set from the equipment's rated speed. Actual cycle time is what the process really achieves while running. The gap between them is speed loss.
If actual cycle time ever appears faster than ideal, the ideal cycle time has been set incorrectly and should be corrected, because every OEE calculation built on it will be inaccurate.
How does cycle time affect OEE?
Cycle time drives the Performance factor of OEE. The formula is Performance = (Ideal Cycle Time x Total Count) / Run Time. When actual cycle time creeps above ideal, the line makes fewer parts per running minute, the numerator shrinks relative to run time, and Performance falls.
Slow cycles and small stops both show up here, which is why cycle time drift can erode OEE without ever triggering a downtime alarm.
What is the difference between cycle time and takt time?
Cycle time is the pace your line actually hits, measured on the floor. Takt time is the pace you need to hit to meet customer demand, calculated as available production time divided by demand. Takt time is the ceiling set by the market, while cycle time is the capability you control.
A healthy line keeps cycle time comfortably below takt time so it can meet orders without overtime or extra capacity.
How can manufacturers reduce cycle time?
The fastest gains come from eliminating small stops and slow cycles rather than running equipment harder. Measure the per-unit cycle instead of only the shift average, hunt micro-stops like jams and misfeeds, validate the ideal cycle time benchmark, reduce changeover variation with SMED, standardize operator method across shifts, and address tooling and lubrication drift early through preventive maintenance. The common requirement is real-time visibility into every cycle.
Why is real-time cycle time monitoring better than manual logging?
Cycle time drift is invisible to the human eye because each lost fraction of a second is too small to notice, and manual logs only surface the problem days later as an average.
Reading cycle times directly from machine PLCs captures every completed part and compares it to the ideal cycle time instantly, so the Performance factor moves the moment drift starts and the cause can be flagged and fixed before it erodes OEE for an entire shift.
How do you calculate cycle time for a line with several steps?
Time each step. The line's cycle time is the time of its slowest step, the bottleneck, because that step sets how often a finished unit leaves the line. Adding the step times together gives the total processing time per unit instead.
How do you convert cycle time into units per hour?
Divide 3,600 by the cycle time in seconds. A 30 second cycle time gives 3,600 ÷ 30 = 120 units per hour while the line is running.
Related: reduce manufacturing lead time, compressing the full order-to-delivery window, not just the machine cycle.
See cycle time and OEE live from machine data, per line and shift.
Book a demoRelated articles












Real Fabrico tiles, sample data.