


 Login
 Blog

Genchi Genbutsu: Meaning, Toyota Origin and a Go-and-See Protocol

In short: Genchi genbutsu is a Toyota principle that means going to the actual place to see the actual thing before you decide. Toyota's own history translates it as going to the source to find the facts. A manager who wants to fix a stoppage goes to the machine, watches it and talks to the operator, instead of judging from a report.
- Genchi means the actual place; genbutsu means the actual thing. Gemba is the place, genchi genbutsu is the act of going there to see.
- It is one of five values in the Toyota Way 2001, next to challenge, kaizen, respect and teamwork.
- Data does not replace it. Data tells you where and when to go; your eyes tell you why the loss happens.
Guide, updated 14 November 2026. Sources are listed at the end.
Genchi genbutsu meaning
Genchi genbutsu (現地現物) is Japanese for "actual place, actual thing". In Toyota's usage it is a working rule: understand a problem by going to where it happens and looking at it yourself, not by reading about it in an office. Toyota's 75-year company history glosses it as "go to the source to find the facts". Toyota Europe's page on the Toyota Way spells out the practice: go and see the location or process where the problem exists, grasp the problem, confirm the facts and analyse root causes.
The principle is older than the phrase in any booklet. In a message for Toyota's 75th anniversary in November 2012, then chairman Fujio Cho wrote in the company's anniversary message that founder Kiichiro Toyoda thoroughly applied genchi genbutsu, "going and seeing for oneself", while studying every part of car production.
Genchi genbutsu at Toyota
Toyota wrote its values down in 2001. According to the same company history, a Toyota Way Compilation Project secretariat was set up in October 1998, and the values were compiled as the Toyota Way 2001 in April 2001. The booklet explains five key concepts:
- Challenge
- Kaizen, continuous improvement
- Genchi genbutsu, go to the source to find the facts
- Respect
- Teamwork
The production system around it is built to make problems visible at the source. On Toyota's Toyota Production System page, jidoka means machines stop when they detect a problem, and when equipment stops, the andon board lights up to call people to the abnormality. The andon tells you where. Genchi genbutsu is what you do when you get there.
Genchi genbutsu vs gemba
The two words are often used as if they were the same. They are close, but not identical:
- Gemba (現場) is the real place where value is created: the line, the cell, the warehouse.
- Genchi genbutsu is the habit of going to that place and looking at the real thing, the part, the machine, the operator's hands, to get facts before deciding.
- A gemba walk is a routine built on that habit: a regular visit to the floor, usually with a set route and questions.
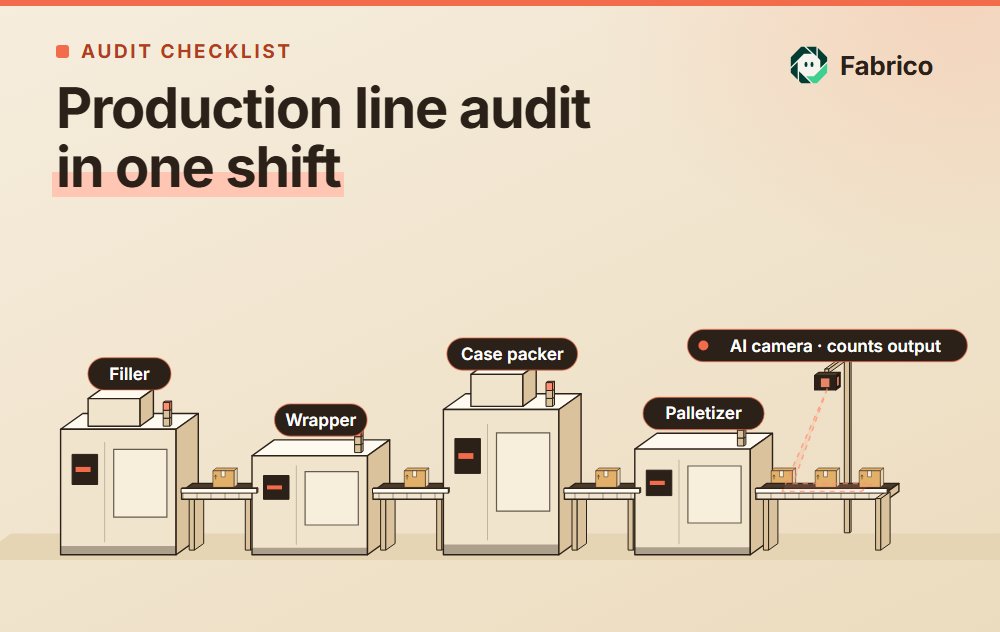
So gemba is the where, genchi genbutsu is the why and how, and the gemba walk is one when. You can do a gemba walk without genchi genbutsu, by walking the route and looking at boards. You can also practise genchi genbutsu without a scheduled walk, by going to the filler at 2 am because that is when it jams.
| Genchi genbutsu | Gemba walk | Safety tour | Dashboard review | |
|---|---|---|---|---|
| Purpose | Get facts about one problem | Regular contact with the floor | Find hazards, show commitment | Track results across lines |
| Trigger | A loss, defect or complaint | The calendar | The calendar or an incident | The meeting schedule |
| Where | Exactly where and when the problem happens | A set route | A set route or an area | An office or screen |
| Output | Confirmed cause and a countermeasure | Observations, questions, small fixes | Hazards logged, actions | Priorities and questions |
| Risk | Chasing one loud problem | Becoming a ritual | Becoming an inspection staff dread | Deciding without seeing |
Why go and see at all
Reports compress. A downtime report says "filler: 21 hours lost, jams". It does not say that the jams happen on one bottle size, on one shift, right after a changeover, because the guide rails are set by eye. Only someone standing at the filler sees that. Three things are lost between the floor and the report:
- Context: what else was happening, which product, which crew, which batch of material.
- Detail: the worn part, the workaround, the extra walk to fetch a tool.
- People's knowledge: operators usually know why something fails. They are rarely asked in the right place at the right time.
Regulators make the same point about leadership. The UK Health and Safety Executive's leaflet for directors, Leading health and safety at work (INDG417), says leadership is more effective when board members are seen on the shop floor, and suggests extra shop floor visits to gather information for the board's formal review.
When going to see goes wrong
Visits from senior people can also backfire. A qualitative study of hospital safety walkrounds by Martin and colleagues in the Joint Commission Journal on Quality and Patient Safety (2014), based on 82 interviews, found that evidence for walkrounds' effectiveness is mixed. Walkrounds that turned into inspection were felt as surveillance, could alienate frontline staff and produced unreliable insights. Unannounced visits meant to catch staff off guard undermined the learning they were meant to support. Walkrounds with a clear purpose and an understanding that they were about learning, not blame, were received better.
The lesson carries straight to a factory floor. Go to learn about the process, not to check up on people, and close the loop on what you heard.
A go-and-see protocol driven by loss data
The weak point of many go-and-see routines is the choice of where to go. A manager walks the same route at the same time, sees the same things and misses the line that lost four hours last night. Loss data fixes that. It does not replace going; it tells you where and when to go.
- Rank losses in money. Take the stop log for the last four weeks and multiply stop minutes by the value of a line minute. A Pareto chart helps: the US Agency for Healthcare Research and Quality's Pareto chart guide describes bars sorted from largest to smallest, measured by frequency, cost or time, with a cumulative line that shows where the vital few end.
- Pick where and when. Slice the top loss by machine, product, shift and hour. The aim is a narrow target: this filler, this bottle, this shift, the first hour after changeover.
- Go at that time. If the loss happens on nights, go on nights. A visit at 10 am to a problem that happens at 2 am is a tour, not genchi genbutsu.
- See, ask, measure. Watch at least one full occurrence. Ask the operator what happens, what they do about it and what they think causes it. Measure what you can: settings, gaps, times, counts. Write down facts, not opinions.
- Act within 24 hours. One countermeasure, an owner and a date. Tell the crew what you saw and what will change.
- Check the data. Compare the same loss, on the same slice, for the next four weeks. If it did not move, go back and look again.
Then take the next loss on the list. Over a quarter, this sends managers to the few places where the money is lost, at the moments when the cause is visible.
Worked example: a bottling line
Example data. All figures below are assumed, except the margin and the cost of a manager's hour, which are from published data as marked.
A sauce bottling line fills 300 bottles a minute when it runs. At a sample ex-works price of $0.36 a bottle and the 23.23% gross margin that NYU Stern's margin dataset reports for 78 US food processing firms (January 2026 data, accessed 15 November 2026), each bottle contributes about $0.0836, so a line hour is worth about $1,505 and each minute of stoppage costs about $25.09. Over four weeks its stop log shows 3,800 minutes of stops:
| Stop reason | Minutes in 4 weeks | Cumulative share | Cost at $25.09 a minute |
|---|---|---|---|
| Filler jams | 1,260 | 33.2% | $31,613.40 |
| Changeovers | 980 | 58.9% | $24,588.20 |
| Labeller faults | 610 | 75.0% | $15,304.90 |
| Waiting for material | 420 | 86.1% | $10,537.80 |
| Capper adjustments | 230 | 92.1% | $5,770.70 |
| Other | 300 | 100% | $7,527.00 |
| Total | 3,800 | $95,342 |
Step 2: slice the top loss
Filler jams cost $31,613.40 in four weeks. Sliced by shift and product, 70% of the jam minutes (882 of 1,260) are on the night shift, and almost all of those on 1-litre bottles, in the first hour after the changeover from 0.5 litre. The day shift runs the same product with far fewer jams.
Steps 3 and 4: go, see, ask, measure
The production manager goes to the filler on the night shift during a 1-litre run. In the first hour she sees three jams. The operator shows her that the infeed guide rails are adjusted by eye at changeover, and on nights there is no one to check them. She measures the gap: on the jamming side it is a few millimetres tighter than on the day shift's settings, which the day lead keeps on a note in his locker. None of this was in the stop log, which says only "filler jam".
Steps 5 and 6: act and check
Next morning the team marks the rail positions for each bottle size, adds a gauge and puts the setting on the changeover sheet. Four weeks later, filler jams on nights have fallen by 60%, from 882 minutes to about 353, so total jams fall by 529 minutes.
- Saving: 529 minutes x $25.09 = $13,272.61 every four weeks.
- Over 12 four-week periods: $159,271.32 a year from one finding.
What the walks cost
The BLS Employer Costs for Employee Compensation, Table 4, puts the cost of an hour worked for private industry management, business and financial occupations at $88.63 in June 2026, wages and benefits together. A manager who spends 30 minutes a day, 5 days a week, 48 weeks a year on go-and-see uses 120 hours, or 120 x $88.63 = $10,636 a year. One data-led visit in this example returned about 15 times that. A walk chosen by habit instead of by loss data might have looked at the labeller on day shift and found nothing.
Book a demo and see losses per line and shift.
Common mistakes
- Going at the wrong time. Problems that happen on nights, at changeovers or at shift start are invisible at 10 am. Let the data set the time.
- Looking at boards instead of the thing. A walk from one whiteboard to the next is a meeting on foot. Watch the machine and the work.
- Turning it into inspection. Martin and colleagues found walkrounds that felt like surveillance produced concealment, not facts. Say why you are there and what you are looking for.
- Bringing the answer with you. If you already know the cause, you will see it. Ask open questions and measure.
- No follow-up. If people tell you about a problem and nothing changes, they stop telling you. Act within a day and report back.
- Going without data, or staying with data only. Walking blind wastes time on small problems. Reading reports only misses the cause. The two need each other.
- Chasing the loudest problem. The machine that someone complained about this morning is not always the one costing you money. Rank by money first.
For plant, production, maintenance and CI managers
This week
- Pull four weeks of stop data for your bottleneck line. If you have no stop log, ask operators to note stops and reasons on paper for a week.
- Agree on the value of a line minute with finance, and rank stop reasons by money.
- Slice the top reason by shift, product and hour, and pick one narrow target.
- Go and see it at the time it happens, with the shift lead. Write down what you see, what the operator says and what you measure.
- Agree one countermeasure with an owner and a date, and tell the crew.
This quarter
- Make the protocol a standing routine: one data-led go-and-see per line per week, chosen from the loss ranking.
- Keep a one-page log: target, date, facts seen, countermeasure, loss before and after.
- Bring supervisors and maintenance leads into the routine so it runs on every shift, not only when the manager is in.
- Review the loss ranking monthly and move to the next target once a loss has dropped and stayed down.
- Put the saving in money each month, next to the time spent on visits.
The data side works best when stops are recorded automatically with a reason. OEE monitoring gives you stop minutes by machine, product and shift, and OEE software ranks them, so the choice of where to go takes minutes. A light MES adds the orders and changeovers, which is how a pattern like "first hour after the 1-litre changeover" shows up.
How Fabrico fits
Fabrico is a cloud OEE and light MES platform. It shows OEE and losses by machine, line and shift, from the PLC or a Fabrico IoT device, with the reasons operators add on a tablet or phone. That is the loss ranking that tells a manager where and when to go and see.
On manual stations, AI cameras (an add-on) count output.
What people ask next
What does genchi genbutsu mean?
It means going to the actual place to see the actual thing. Toyota's company history glosses it as go to the source to find the facts: you understand a problem by looking at it where it happens, not by reading a report.
What is the difference between genchi genbutsu and gemba?
Gemba is the real place where value is created, such as the line or the cell. Genchi genbutsu is the habit of going there and looking at the real thing to get facts before deciding. A gemba walk is a regular routine built on that habit.
Is genchi genbutsu part of the Toyota Way?
Yes. The Toyota Way 2001, compiled in April 2001, explains five key concepts: challenge, kaizen, genchi genbutsu, respect and teamwork. Toyota also says its founder Kiichiro Toyoda applied genchi genbutsu thoroughly.
How do you practise genchi genbutsu in a factory?
Rank your losses in money, slice the top one by machine, product and shift, and go and watch it at the time it happens. Ask the operator, measure what you can, act within 24 hours and check the same loss in the data over the next four weeks.
Is genchi genbutsu the same as management by walking around?
No. Walking around is a general habit of being visible on the floor. Genchi genbutsu is aimed at one problem: you go to where and when it happens to confirm the facts and find the cause.
Can data replace going and seeing?
No. Data tells you where and when the losses are. It rarely tells you why: the worn part, the setting done by eye, the workaround. The two work together: data picks the target, and going to see finds the cause.
Sources
All sources accessed on 14 November 2026, except those marked as accessed on 15 November 2026. Dates are the publication dates shown on each page.
- Toyota Motor Corporation, 75 Years of Toyota, Human Resources Development (Toyota Way 2001), 2012, accessed 14 November 2026
- Toyota Motor Corporation, 75 Years of Toyota, Message from Fujio Cho and Akio Toyoda, November 2012
- Toyota Motor Corporation, Toyota Production System, undated, accessed 14 November 2026
- Toyota Motor Europe, The Toyota Way, undated, accessed 14 November 2026
- UK Health and Safety Executive, Leading health and safety at work, INDG417(rev1), June 2013
- Martin G, Ozieranski P, Willars J and others, Walkrounds in Practice: Corrupting or Enhancing a Quality Improvement Intervention?, Joint Commission Journal on Quality and Patient Safety 40(7), July 2014
- US Agency for Healthcare Research and Quality, Workflow Assessment for Health IT Toolkit, Pareto Chart, undated, accessed 14 November 2026
- US Bureau of Labor Statistics, Employer Costs for Employee Compensation, Table 4, June 2026, 9 September 2026
- NYU Stern, Aswath Damodaran, Operating and Net Margins by Industry (US), Food Processing row, January 2026 data, accessed 15 November 2026
Related articles








Real Fabrico tiles, sample data.