


 Login
 Blog
Production Line Audit Checklist: One Shift Before You Buy a System

In short: A production line audit checklist for a food or FMCG line covers one shift at the line: time the stops, changeover and start-up, count output and rejects at the constraint, photograph the boards, paper logs and HMI, and ask operators where the numbers come from. Then rebuild A x P x Q from what you measured and set it against the paper record.
- Count at the constraint machine, not at the end of the line.
- Sort each finding: a system would help, it would not, or not yet.
Before a plant chooses OEE software, a light MES or a camera add-on, someone should spend one shift at one line with a stopwatch, a tally sheet and a phone. The audit gives a baseline no vendor wrote and shows where a machine signal exists.
It is not a gemba walk. A gemba walk checklist steers a regular walk with data you already trust; this audit tests whether the data deserves that trust. Nor is it a compliance audit for quality, food safety or certification, the kind gemba walk vs audit describes. Where a plant already runs an OEE system, a manufacturing data quality audit checks that system's numbers against the PLC log; this one comes before any system is chosen.
Set up the audit: one line, one constraint, one shift
Pick the line first in the queue for a system, then settle four things before the shift:
- The constraint: the machine that sets the pace, such as the filler or the flow wrapper. Every count is taken there.
- Its rated speed: the nameplate or acceptance-test rate for the product, written on the sheet, not the planning rate.
- Planned production time: shift length less planned breaks and planned cleaning.
- The crew briefing: you are measuring the line, not the people.
For packaging machines, EN 415-11 covers how efficiency and availability are determined; DIN lists it as DIN EN 415-11, edition 2021-12. Ask the line builder which definition its figures follow.
Audit safety. The auditor watches and never reaches in. In the UK food and drink industries, HSE's food machinery guidance (undated) says machinery and plant cause over 30% of fatal injuries, conveyors are involved in 30% of machinery accidents, and 90% of those accidents occur during normal foreseeable operations such as production and clearing blockages. In the US, OSHA 1910.147 exempts minor servicing during production from lockout only when it is routine, repetitive and integral to production and done with alternative measures that give effective protection. Agree with the shift lead where you stand, time jams from outside the guards, and note how each one is cleared: that is a finding too.
Time it: stops, the changeover and start-up
Set the threshold before the shift starts. Here, stops of 2 minutes or more are timed one by one and shorter ones go on a tally. The split is about attention: one auditor at the constraint cannot write start, end, machine and cause for every 20-second jam and still see the next one, but a stroke on a tally costs a second. Write the threshold at the top of the sheet, because the paper log may use a different one, and the comparison only holds when both sides count the same stops.
Stops caused elsewhere. When a machine upstream starves the constraint or one downstream blocks it, the constraint still lost the time, so log the stop there and write the machine that caused it in the cause column. A changeover can move the constraint for a while: if the filler is changed first and the bagger waits for product, log the wait as part of the changeover, not as a starved stop. Otherwise one event is split over two causes and the changeover looks shorter than it was.
The changeover. Start the clock at the last good pack of the old run and stop it at the first good pack of the new one. Crews often start their own clock at the first tool on the machine and stop it when the line restarts, which is one reason a paper changeover can read short: 36 minutes on paper against 41 timed in the sample below. Note the time as each step ends; the step list in the changeover checklist makes a good set of column headers. Slow running after the first good pack belongs in performance, not here.
Start-up. Time the line from shift start to the first good pack, then on to the minute it holds rated speed. Paper rarely shows this window, because the line counts as running through it. Rejects made in it are a quality loss, as startup loss vs reduced yield loss sets out, so mark on the tally which rejects fell before the line settled.
Count it: output at the constraint, rejects, minor stops
Output. Read the counter on the constraint, not the one at the end of the line: an end-of-line counter may count cases, include rework fed back in, or miss what a downstream machine scrapped. Photograph every reading. Some counters reset at a changeover or a recipe change, so take one reading just before the changeover and another just after it; a reset found at shift end cannot be repaired. Where there is no counter, count by hand for ten minutes each hour and mark the figure as a sample, not a total.
Rejects. Before the shift, walk the line and note where each reject leaves it, and whether that point sits before or after the constraint's counter. A checkweigher after the bagger takes out bags the bagger already counted, so good output is the count minus those rejects, as in the example below. A pack pulled out before the counter never reached it: it is a loss upstream and does not come off the count. Start-up scrap often goes into a bin rather than through the checkweigher; weigh the bin and divide by the pack weight instead of guessing.
Minor stops. Tally stops under 2 minutes at the constraint in a separate box for each hour. The hourly split is the useful part: minor stops that bunch after a changeover or a film reel change often point to a setting, while a steady rate points to the machine or the product. They count under performance; reduced speed loss vs minor stops explains the split. The US EPA page on TPM losses calls stops of zero to 10 minutes difficult to record manually and usually hidden from efficiency reports, which is why the audit tallies them by hand rather than trusting the log.
Performance is easy to take on trust. A 2016 Chalmers PhD thesis studied six months of records from 884 machines in 23 companies, across industries rather than food alone, with data from a production follow-up software vendor. For 702 machines, or 80%, recorded performance was 100%, and for 796, or 90%, recorded quality was 100%; the author tied this to 100% being the system's default. In that data an unchanged default made both factors look perfect; a checked rated speed and counted rejects on your sheet stop that.
Photograph it: boards, paper logs and the HMI
The board. Note when each hourly figure is written, not only what it says. A figure written late in the hour, or all at once at shift end, comes from memory or a target; one copied from the counter on the hour matches your reading within a few packs. A photo each hour shows when each figure appeared.
The paper log. Match each entry to a stopwatch row by start time, then look at what is left over: stops on your sheet that are missing from the log, and log entries with round durations such as 10 or 15 minutes, which point to memory rather than a clock. Count the blank and "other" causes too; they show whether the reason list fits the line.
The HMI. The alarm history is a second clock: if its stop times agree with your stopwatch, the line has a likely source a system could read, and the controls engineer can confirm whether the PLC exposes it. Photograph the counters, the alarm history and the speed setpoint, and compare the setpoint with the nameplate rate; a setpoint below nameplate is a performance loss that no log records. HMI data collection for OEE covers what can be read there, and OEM line monitoring vs OEE software covers the line builder's screens.
A 2016 Chalmers conference paper on the same 884 machines reports that almost half of the recorded OEE losses could not be classified, because loss categories were missing or poorly described. If the paper log has many blank or "other" entries, the fix is covered in unclassified downtime.
Ask it: what operators and shift leads know
Much of the time is in the crew's hands: in the same thesis, about 90% of classifiable downtime related to supporting work done by operators, not to the automatic process. Food plants also run on people: Eurostat's statistics on EU manufacturing businesses name the manufacture of food products as the largest manufacturing division by employment in 2023, in a sector of around 30.2 million persons employed. Ask after a stop, not during one. Beside the three Ask questions in the checklist below, try these two:
- What happens in the first 20 minutes after a changeover?
- Which machine starves or blocks the constraint most?
The production line audit checklist, 12 items
Print one sheet per line and shift; write the figure beside each item.
Time
- Stops of 2 minutes or more: start, end, machine and the cause as you saw it.
- The changeover: last good pack of the old run to first good pack of the new one, each step timed.
- Start-up: shift start to first good pack, then the minutes until the line holds rated speed.
Count
- Output at the constraint: counter read at shift start, every hour and at shift end.
- Rejects: bins, checkweigher rejects, start-up scrap and rework, counted rather than estimated.
- Minor stops per hour: stops under 2 minutes tallied at the constraint, hour by hour.
Record
- The board: a photo of each hourly entry, set beside your counter reading for that hour.
- The paper log: a photo of the stop entries, each set beside your stopwatch row.
- The HMI: counters, alarm history and the speed setpoint against the nameplate rate.
Ask
- Operators: which stop do you clear most often without writing it down?
- Shift leads: what speed do you plan this product at, and who set it?
- Both: when is the board filled in, and from what?
The card below carries 8 of the 12 items.
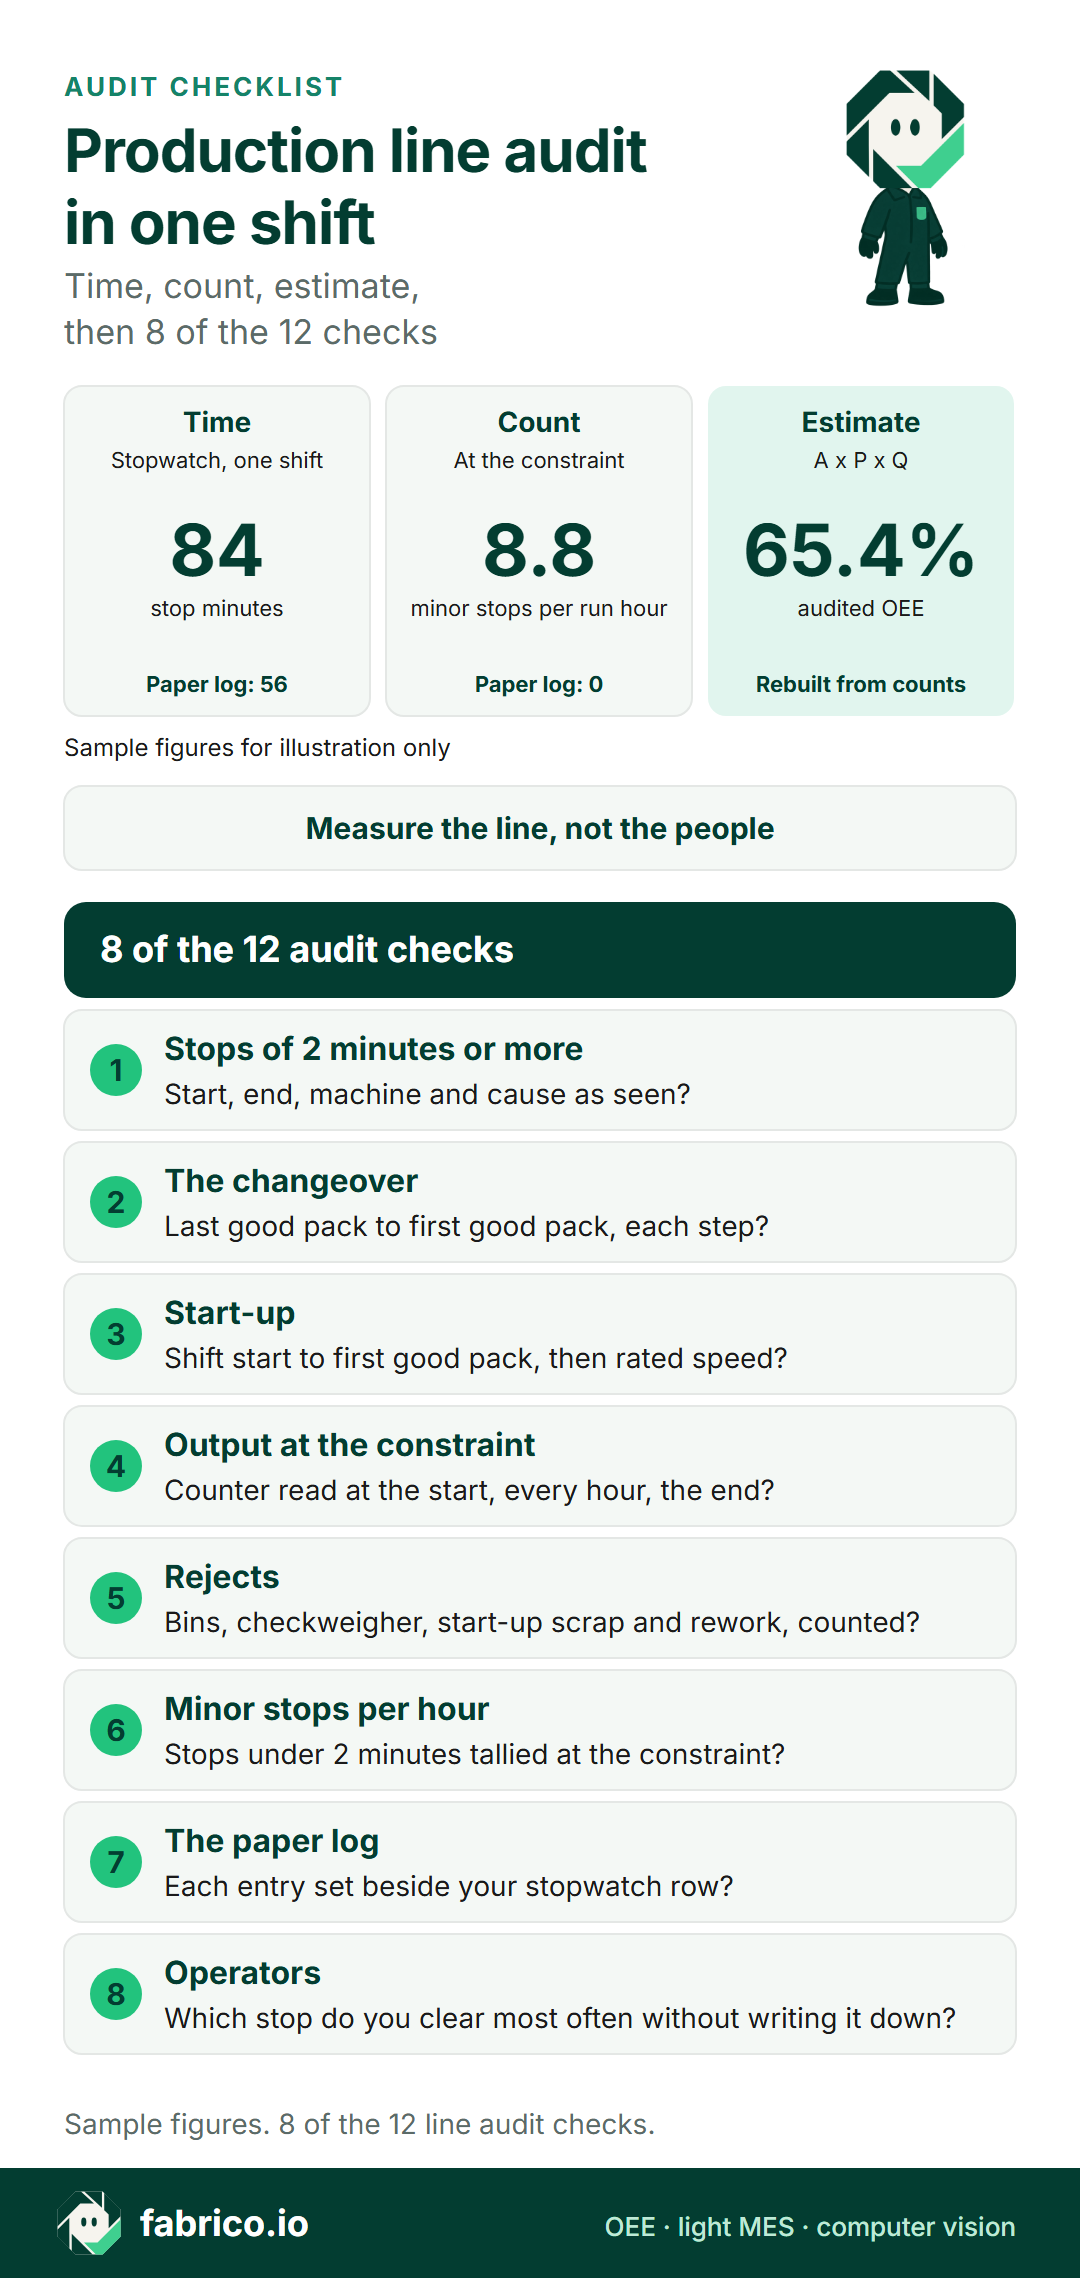
Text version of this infographic
- Title: production line audit in one shift.
- Sample figures for illustration only.
- Time: 84 stop minutes timed with a stopwatch in one shift; the paper log showed 56.
- Count: 8.8 minor stops per run hour at the constraint; the paper log showed none.
- Estimate: audited OEE of 65.4%, rebuilt from counts as availability x performance x quality.
- Measure the line, not the people.
- 8 of the 12 checks: stops of 2 minutes or more, the changeover, start-up, output at the constraint, rejects, minor stops per hour, the paper log, operators.
Worked example: one audited shift on a crisps bagging line
Sample figures for illustration only. One 8-hour shift with 40 minutes of planned breaks and cleaning gives 440 minutes of planned production time. The vertical bagger is the constraint, rated at 90 bags a minute for this bag size. Two people hand-pack cases at the line end.
| Measure | Paper log | Audit |
|---|---|---|
| Stop minutes, 2 min or more | 56 | 84 |
| of which changeover | 36 | 41 |
| of which start-up to first good bag | Not logged | 11 |
| Minor stops under 2 min | 0 | 52 (8.8 per run hour) |
| Bags at the bagger | 27,600 (board) | 26,900 (counter) |
| Rejects | 300 | 1,010 |
A x P x Q from the audit:
- Availability: 440 minus 84 = 356 run minutes; 356 / 440 = 80.9%.
- Performance: 26,900 bags against 356 x 90 = 32,040 possible: 84.0%. The 52 minor stops sit here.
- Quality: 26,900 minus 1,010 rejects leaves 25,890 good bags; 25,890 / 26,900 = 96.2%.
- OEE: 80.9% x 84.0% x 96.2% = 65.4%. Check: 25,890 / (440 x 90) = 65.4%.
From the paper log alone, availability would read 87.3% and quality 98.9%; with no rated speed on the sheet, performance could not be computed. OEE calculation explains the factors.
What the shift says about a system:
- 28 stop minutes and all 52 minor stops were missing from paper. The bagger's HMI shows a counter and run state, so a PLC reading would likely catch them; Friday's check with the controls engineer confirms it.
- The board read 27,600 bags against 26,900 on the counter, 700 bags or 2.6% too high, and the paper quality of 98.9% sits on that inflated figure. That points to a board filled from targets or memory rather than the counter, the gap checklist item 12 is there to find.
- The 41-minute changeover ignored the changeover standard posted at the line: a system times it, the standard fixes it.
- 560 of the 1,010 rejects fell in the 15 minutes after start-up and changeover, a loss worth counting at the reject point.
- Hand case packing has no signal but did not limit the line, so counting there can wait.
In money. Sample figures for illustration only. At rated speed the bagger could make 440 x 90 = 39,600 bags in the shift; it made 25,890 good ones, so 13,710 were lost. Paper showed none of the performance loss (32,040 minus 26,900 = 5,140 bags), missed 28 stop minutes (28 x 90 = 2,520 bags) and missed 710 rejects: 8,370 bags, 61% of the loss. Take a sample factory price of EUR 0.35 a bag and a sample contribution margin of 14%, or EUR 0.049 a bag. NYU Stern's margin dataset for 78 US food processing firms (January 2026 data, accessed 15.11.2026) gives the bounds to check against. Contribution always beats the 10.63% pre-tax operating margin, because that margin is struck after fixed costs. It often beats the 23.23% gross margin too, since gross margin still carries fixed plant cost. At 14%, the shift estimate errs low. The whole gap of 13,710 bags is worth EUR 671.79 a shift. The unseen part, 8,370 x EUR 0.049, is EUR 410.13 a shift, or EUR 282,989.70 over 690 shifts a year (3 shifts, 5 days, 46 weeks). That value holds while the line is capacity-bound and the extra bags would sell; if demand is the limit, the gain shows up as overtime or weekend shifts avoided instead.
How sensitive the estimate is. With a planning rate of 80 bags a minute on the sheet instead of the rated 90, performance would read 26,900 / (356 x 80) = 94.5% and OEE 73.6%, 8.2 points better than the line ran, and the performance loss would shrink from 5,140 to 1,580 bags: a milder form of the 100% default in the Chalmers data. Had the changeover run 20 minutes longer, run time falls to 336 minutes, availability to 76.4% and OEE to 61.7%; at the audited 72.7 good bags per run minute (the pace the line really kept, while the money above measures the full gap to rated speed), that is about 1,450 more bags, or EUR 71, lost in the shift.
After the audit: keep paper, read the PLC, add a sensor or a camera
Sort each finding into a row. Some losses need a method or a decision, not software.
| Finding | What it means | Would a system help? |
|---|---|---|
| Paper misses a third or more of stop minutes | Stops need capture at the machine | Yes: machine signal, cause tagged by the operator |
| Minor stops several an hour, none on paper | Performance loss nobody sees | Yes, if the constraint gives a signal |
| No agreed rated speed | Performance cannot be computed | Not yet: settle the speed first |
| Changeover is the largest single loss | Method and standard work | Partly: it times it, people fix it |
| Constraint starved by an upstream machine | The pace is set elsewhere | Not yet: audit that machine |
| Manual station with no signal limits output | No count where it matters | Yes: a camera add-on counts output |
| Paper within about 10% of the audit (your threshold) | Data is fit for use | No case yet: re-audit in a quarter |
Each answer in the chart is an option with its own cost. The effort ranges below are sample figures for one line, with people's time at the euro area industry labour cost of EUR 40.3 an hour (Eurostat, 2025, accessed 15.11.2026). Software, devices and cameras are priced by quote, so they appear here as "the vendor's quote".
| Option | Choose it if the audit shows | Plant effort (sample) | Cost at EUR 40.3 an hour |
|---|---|---|---|
| A. Keep paper, re-audit each quarter | Paper within about 10% of the stopwatch, few minor stops, a rated speed agreed | 18 to 24 h per audit: two people for a shift, then the analysis | EUR 725 to 967 a quarter |
| B. Read the constraint's PLC with OEE software or a light MES | The HMI shows counts and run state, and paper missed stop minutes or minor stops | 5 to 10 h of controls-engineer time to confirm and map the signals | EUR 202 to 403, plus the vendor's quote |
| C. IoT device with sensors on the constraint | No usable PLC signal, but a sensor can see each cycle or pack | 3 to 6 h to agree the sensor position and check its count against a hand count | EUR 121 to 242, plus the vendor's quote |
| D. Camera add-on at a manual station | A hand-pack table or other manual step limits the line and has no signal | 3 to 7 h to agree the counting view and check it against a hand count | EUR 121 to 282, plus the vendor's quote |
In the sample shift the paper record missed 61% of the lost output and the bagger shows a counter and run state, so option B fits; the hand case packing did not limit the line, so option D can wait. Set any quote against the unseen loss the audit priced, EUR 410.13 a shift in the sample, and against the share of it you expect to win back, never against the whole figure.
Questions to put to vendors, or to your own team for option A:
- Which signals does the constraint's PLC expose (count, run state, speed), and who confirms it on our line?
- Will the system record stops under 2 minutes, the ones our tally found?
- Which rated speed does it use for each product, and who may change it?
- How does an operator give a reason for a stop, and how are stops left without one shown?
- How does the data reach our audit spreadsheet: Excel or CSV export, or an API?
- Which hand count do we run to check the system's figures against our audit sheet?
OEE software or a light MES is a scope question for OEE software evaluation and light MES explained; where a plain counter might do, see production counter vs OEE software. For a camera add-on, take the audit sheet to the line camera business case questions and camera or sensor for OEE by machine. To put the lost minutes into money, value them at the constraint, where a lost minute is lost output; the OEE business case guide sets out how to present the result to finance.
Want to see how a connected line records stops like the ones on your audit sheet? Book a demo.
Run your first audit: a plan for this week
- Monday: pick the line and its constraint, and get the rated speed for the main product in writing from the acceptance test or the nameplate.
- Tuesday: print the 12-item sheet, tell the shift lead and crew that the line is measured, not the people, and agree where the auditors stand.
- Wednesday: audit one full shift with a planned changeover, with two people: one at the constraint with stopwatch and tally, one on counters, rejects and photos.
- Thursday: rebuild A x P x Q, set it against the paper record and work out the share of lost output paper missed (61% in the sample).
- Friday: sort each finding into the table above, and send the HMI photos to your controls engineer to confirm which signals the constraint's PLC exposes.
This quarter, repeat the shift with a different crew, and re-audit any line where a system goes in, so before and after use the same sheet.
How Fabrico follows up a line audit
- The tally column, from the machine: the 52 minor stops the audit tallied by hand are what Fabrico picks up as micro-stops from the machine signal, including stops too short for anyone to write down. On the bagger that signal comes from the PLC; an older machine gets a Fabrico IoT device with external sensors.
- The audit's three factors, every shift: availability, performance and quality by machine, line and shift, with shift results that tell the incoming crew where the last one ended.
- A home for the "other" entries: operators pick why the line stopped from the plant's own reason codes on a tablet or phone, and the stop log then reads by cause, machine and shift for this week or a past period.
- A manual station, if one limits the line: in the sample, hand case packing did not, but if a later audit finds a hand-pack table setting the pace, the camera add-on counts the cases there. The camera add-on's video for a stop minute is streamed on request and not stored in Fabrico. In development: the camera add-on proposing a likely cause for the operator to confirm with one tap.
- The money column: lost minutes are shown in money, and any list goes to Excel or CSV, or out through the REST API and webhooks, next to your audit spreadsheet.
Product detail: the OEE and MES solution overview and the camera add-on page. By sector: food plants in MES for food manufacturing and computer vision for food manufacturing; FMCG plants in MES for mid-size FMCG plants and computer vision for FMCG.
Before the first audit shift: common questions
What is a production line audit?
A structured check of one line over at least one shift: stops, changeovers, start-ups, output and rejects measured at the line and set against the paper record. It measures losses and data quality, not product quality or food-safety compliance.
How long should a production line audit take?
One full shift at minimum, with a changeover in it if one is planned. Two shifts with different crews show whether a loss belongs to the line or to the way each crew runs it.
How are minor stops treated in the A x P x Q estimate?
Stops under the audit threshold, 2 minutes in the example, are tallied rather than timed. Their loss shows up in performance, because the count falls short of run time multiplied by rated speed.
What if nobody agrees on the rated speed?
Take the nameplate or acceptance-test rate for that product and write it on the sheet. Performance cannot be computed without it, so settle it before comparing systems.
Does an audit replace a software pilot?
No. The audit gives a baseline and shows where a system could help. A pilot then shows whether the system records the same losses without a person at the line.
Want availability, performance and quality recorded for every shift, not only the audited one? Book a demo to see a connected line's record.
Related articles


Latest from our blog






Real Fabrico tiles, sample data.