


 Login
 Blog
Production Counter Display or OEE Software: Which Do You Need?

In short: a production counter display shows how many units the line has made against target, right now. That is enough when the only question is whether the line is on plan. When you also need to know how long the line stopped, why, and whether it ran slow, you need stop times and reasons, which is the job of OEE software.
- A counter answers one question well: how many, against what target, now.
- The count alone cannot split stops from slow running, or tell you why the line stopped.
- Two sample shifts below show the same count, the same OEE and opposite fixes.
- Eight checks decide it. If only the first two matter, a counter fits.
You have two quotes on the desk. One is for an LED counter board with a sensor on the conveyor. The other is for OEE software. Both put a number on a screen, so they look like two prices for the same thing. They are not. This guide helps plant managers, CI and engineering leads pick one, or the order to buy both.
Disclosure: Fabrico, our product, is an OEE and light MES platform, so check our claims against data from your line.
What a production counter display answers
A production counter system has three parts: a sensor that sees one unit pass, a controller that adds it up, and a display that shows the count next to a target. The sensor can be a photo eye, a proximity switch, a count signal from the PLC, or a camera. Our guide to photo eye output counting covers sensor choice, and AI visual counting covers stations where a sensor cannot see the product.
The idea is old and sound. The Lean Enterprise Institute lexicon describes a production analysis board as a display located beside a process to show actual performance compared with planned performance. A counter board is the electronic version.
So a good counter display answers, from across the hall: how many so far, how many by now, and how far ahead or behind.
If you want help with what else goes on the screen, read what to show on a production display board. For the hourly version kept by hand or on a screen, see the hour by hour board, and for the planning side, target vs actual production tracking.
What the count alone cannot tell you
A count is the result, not how it came about. From the number alone you cannot see:
- How long the line stood still. Behind by 4,000 units could be one long stop or seventy short ones.
- Why it stopped. A changeover overrun, a jam at the case packer and waiting for material all look the same on a counter.
- Whether it ran slow. A line that never stops but runs below its ideal rate loses output with no stop to record.
- What happened last week. A display shows now; trends need kept history.
Recording stops is not the same as knowing them, either. A 2016 doctoral thesis from Chalmers University of Technology in Sweden analysed six months of production follow-up data from 23 companies and 884 machines, supplied by one production follow-up software company. Unclassified losses were about 19% of scheduled production time, more than half of all recorded loss time. And 702 of the 884 machines (80%) had a recorded performance rate of 100%; the author linked that to 100% being the default value in the measurement system, not to machines running at full speed. Those plants recorded stops, but most of the lost time had no reason, and most machines had no real speed.
| Question at the line | From the count alone | With stop times and reasons |
|---|---|---|
| Are we on target now? | Yes | Yes |
| How long did we stop? | No | Yes, per stop |
| Why did we stop? | No | Yes, if someone tags it |
| Did we run slow? | No | Yes, with an ideal rate |
| Which shift lost most, and to what? | No | Yes, with history |
| What did the loss cost? | No | Yes, with your margins |
If the board you are weighing is a full scoreboard rather than a counter, our older comparison of passive scoreboards and integrated OEE covers that wider choice.
Worked example: same board, two different problems
Sample figures for illustration only. One line, a shift of 480 minutes with a 30 minute break, so 450 minutes of planned production time. The ideal rate is 60 units a minute, so the shift could make 450 x 60 = 27,000 units. The plant sets the target at 24,000.
Shift A. The line stops for 60 minutes in total: one changeover takes 25 minutes, and 70 short stops of about 30 seconds add 35 minutes more (25 + 35 = 60). The counter after the machine reads 20,000 units. A checkweigher later rejects 600, so 19,400 are good.
- Run time: 450 minus 60 = 390 minutes.
- Availability: 390 / 450 = 86.7%.
- Performance: 20,000 / (390 x 60) = 20,000 / 23,400 = 85.5%.
- Quality: 19,400 / 20,000 = 97.0%.
- OEE = availability x performance x quality = 0.867 x 0.855 x 0.970 = 71.9%. Check: 19,400 good units / 27,000 possible = 71.9%.
The 7,600 units between 27,000 and 19,400 split three ways: 60 minutes x 60 = 3,600 lost to stops, 23,400 minus 20,000 = 3,400 lost to slow running, and 600 lost to rejects (3,600 + 3,400 + 600 = 7,600).
Shift B. Same line, same counter reading of 20,000, same 600 rejects. But it stops for only 20 minutes, so run time is 430 minutes, and it runs slow the rest of the time.
- Availability: 430 / 450 = 95.6%.
- Performance: 20,000 / (430 x 60) = 20,000 / 25,800 = 77.5%.
- Quality: 19,400 / 20,000 = 97.0%.
- OEE = 0.956 x 0.775 x 0.970 = 71.9%, the same as shift A.
Here the 7,600 units split as 1,200 lost to stops (20 x 60), 5,800 lost to slow running (25,800 minus 20,000) and 600 to rejects. Shift A needs a changeover plan and a look at the short stops; our guide to micro-stops covers those. Shift B needs someone to find out why the line runs below its rate. The board showed the same number for both. For the formulas, see how to calculate OEE.
Counter or OEE software: how to decide
Pick a counter display if the product mix is stable, the team knows why the line stops and the only daily question is whether you are on plan; add stop times and reasons once the board keeps showing a gap nobody can explain. Go to OEE software for speed loss, shift history or several lines in money terms, and if a trusted board already hangs on the wall, keep it and let the OEE system read the same count signal.
| Situation | Lean toward | Why |
|---|---|---|
| One product, known stop causes | Counter display | The gap is the only open question |
| Behind target, nobody knows why | Add stop reasons | The count shows the gap, not the cause |
| Many short stops on a packer | Stop times from the signal | Too short and too many to log by hand |
| Line runs, output still low | OEE software | Slow running needs an ideal rate |
| Several lines to compare | OEE software | Same definitions, one view |
| Board on the wall, trusted | Keep it, add OEE | Read the same count signal |
Run a two-week test before you buy either. Hand-tally output for one hour per shift and compare it with the board. Write down each stop longer than a set length, say two minutes, with start, end and reason. If the log explains the gap to target, a counter plus a stop log fits. If a gap remains, it is short stops or slow running, a job for OEE software.
Bring those board readings and stop logs to a demo.
Is a camera one more counter option?
Yes. A camera that counts units is a sensor with a wider view. It helps where a photo eye struggles: hand-pack tables, bagging stations, mixed products on one belt. Read camera or sensor by machine before you choose, and how accurate camera OEE is for how to test a count against a hand tally.
In Fabrico, the camera add-on counts output where there is no usable machine signal. When someone reviews a stop at a camera add-on station, the video for that moment is streamed when it is opened and is not stored in Fabrico in the standard setup. Roadmap: stop-reason suggestions from the camera add-on, confirmed by the operator, are in development and not part of the product today. See the computer vision add-on for OEE and the camera add-on in FMCG plants.
Checklist: 8 questions before you buy a counter board or an OEE system
Put these to any supplier, and to your own team. If only the first two matter on a line, a counter display fits. If checks 3 to 8 matter, add OEE.
- Where does the count come from: total or good output? A sensor straight after the machine counts total units. Ask where rejects leave the line: at a checkweigher further on, or by hand. If the board shows total output, it reads high against a target for good units. Agree which point is counted.
- Does the target follow the product that runs? A fixed target is wrong for half the shift when the line runs two sizes at different speeds. Ask how the target changes at a changeover and who sets it.
- Are stop start and end times recorded? Without them you know you are behind, but not how long the line stood still. Ask whether stop times are kept and exported, or only shown on the screen and lost at the end of the shift.
- Who enters the stop reason, where and when? Reasons come from people at the line. Ask how many taps it takes, whether a tablet or phone sits within reach, and what happens to stops nobody tags.
- Can it split slow running from long stops? That needs an ideal rate per product and the run time between stops. Without both, slow running hides inside a good-looking count, as in the second sample shift above.
- How long is history kept, and how does it export? Trends need weeks of shifts, not today's number. Ask for the retention period in writing and test an export to Excel or CSV during the trial, not after you sign.
- Do the same definitions work on the next line? If line 2 counts at a different point or uses its own stop list, the numbers will not compare. Fix one definition for count, stop, planned time and ideal rate first.
- Can losses be shown in money, from your margins? Value them with your own margin per unit, and at the line that limits output, so that the same loss is not counted twice. Sample data: at EUR 0.10 margin per unit, shift A's 7,600 lost units are worth EUR 760.
On check 7: even the definition of OEE varies. A NIST summary report (March 2020) on a May 2019 meeting of an ASME standards subcommittee, hosted at the US National Institute of Standards and Technology, notes that there are currently multiple definitions, interpretations, and calculations for OEE. Pin yours down before you compare two systems, or two lines.
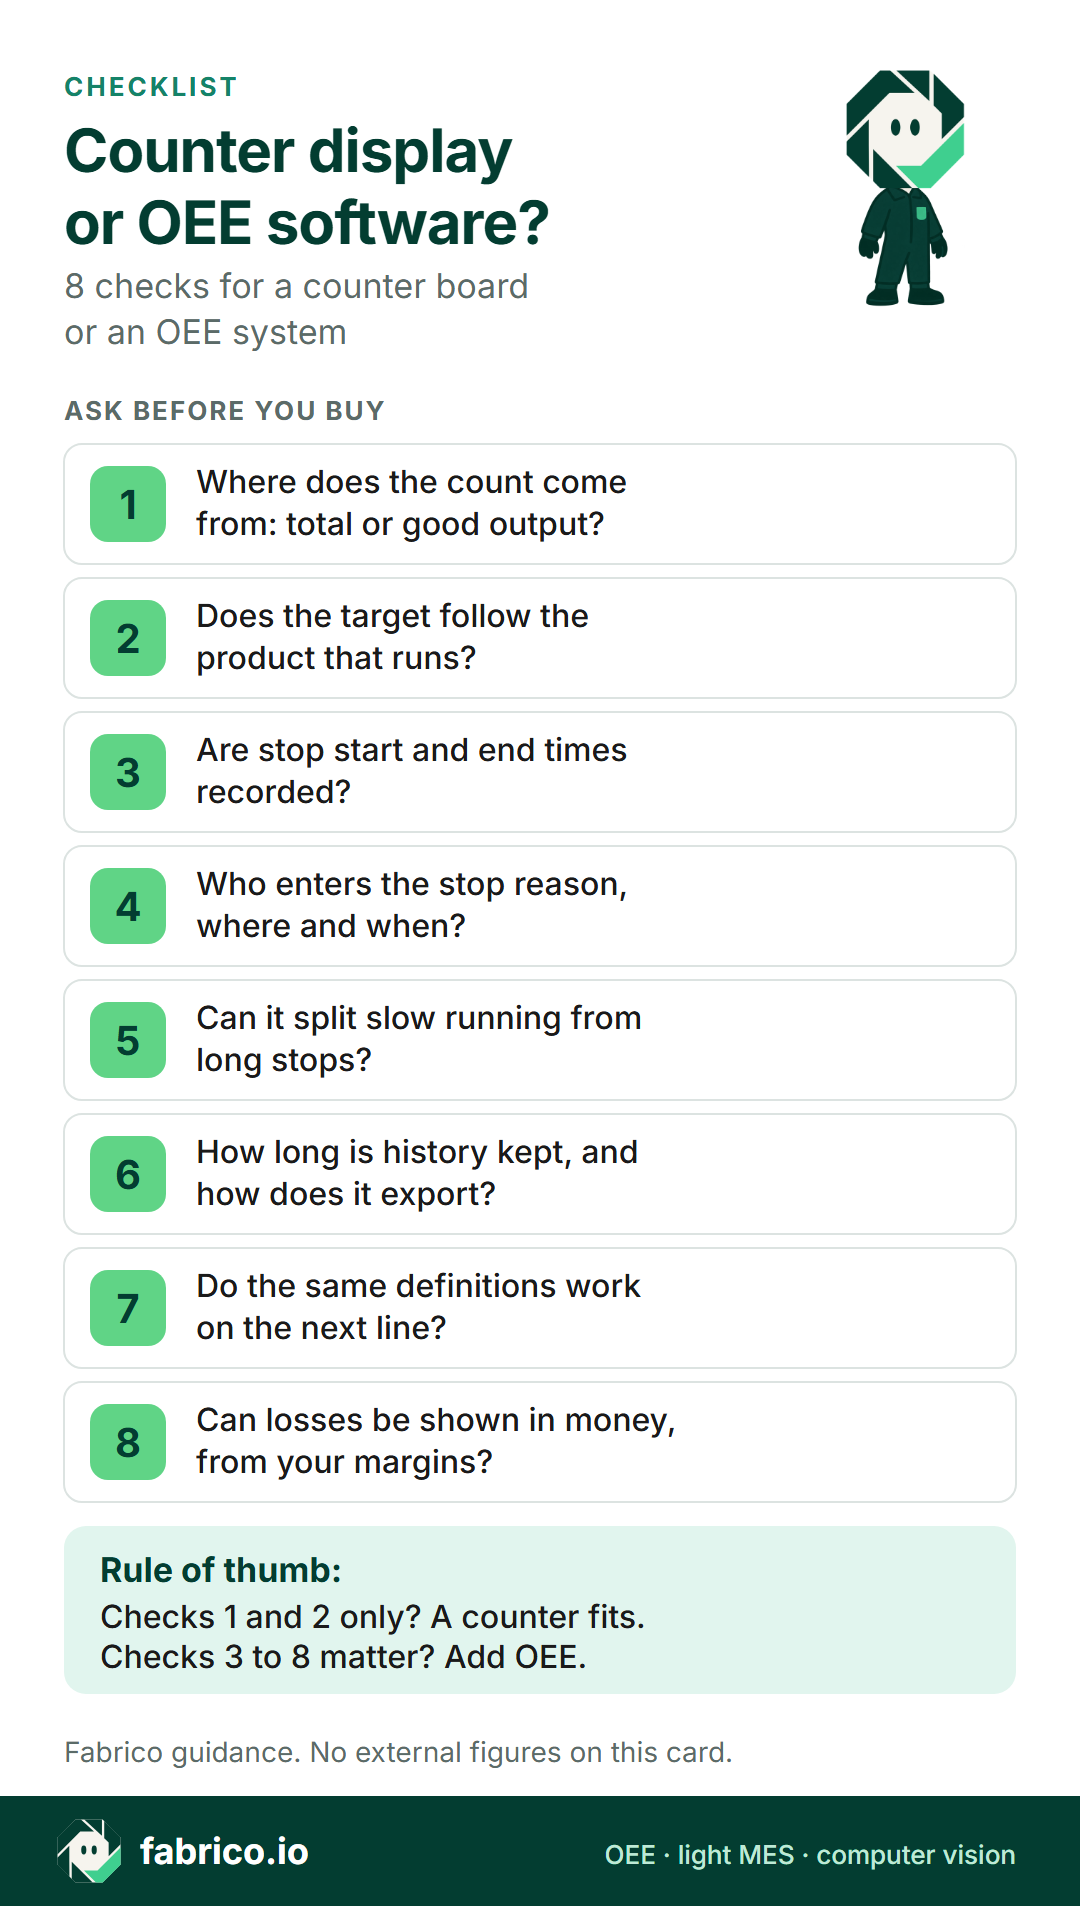
Text version of this infographic
- Checklist card titled Counter display or OEE software, with 8 checks to ask before you buy, from where the count comes from to whether losses can be shown in money, and a rule of thumb:
- checks 1 and 2 only, a counter fits;
- checks 3 to 8 matter, add OEE.
For a wider comparison of systems, see our reviews of machine monitoring software and OEE software. If your machines have HMIs but no clean count signal, read HMI data collection for OEE.
Where Fabrico fits
If you are pricing a counter board against OEE software, Fabrico is the OEE side: the same count, plus stops, reasons and speed.
- The signal you would wire to a counter: Fabrico reads run, stop and count from the PLC where there is one. Older machines get a Fabrico IoT device with external sensors, so neither a new machine nor a new PLC is needed. Short stops are detected from that signal and reported apart from long stops.
- The why a board cannot show: operators tag the cause of a stop on a tablet or phone, from your own list of reason codes, and downtime is shown by cause, machine and shift.
- Shift A versus shift B: stop time and slow cycles show as availability and performance loss for each line and shift, so two shifts with the same count show different losses, and losses are shown in money.
- Stations a photo eye cannot see: the camera add-on counts output at hand-pack tables, bagging stations and older machines with no usable signal.
- Several lines, one set of numbers: every source feeds the same OEE calculation, so lines connected in different ways can be compared side by side. Any list exports to Excel or CSV, and a REST API and webhooks connect other systems.
How targets per product are set, and how a Fabrico screen sits next to a counter board you already own are questions to put to us with your two weeks of board readings. More detail is in the solution overview, our guide to OEE software and what a light MES covers.
What people ask next
Is a production counter display enough to measure OEE?
Not on its own. A count gives you output and, if it counts after rejects, the good count. OEE also needs planned time, stop time and an ideal rate. Ask the counter supplier whether stop times are recorded and exported.
What sensor does a production counter need?
Whatever reliably sees one unit pass: a count signal from the PLC, a photo eye or proximity sensor on the conveyor, or a camera where a sensor cannot see the product. Mount it where only finished units pass, and decide whether it counts total or good units.
Can we keep our counter board and add OEE software later?
Often, yes. The OEE system can read the same count signal, or take its own signal from the same point. Check that both count the same units, or two different numbers will hang side by side on the floor.
Who enters stop reasons, and does it slow the operators down?
The operator at the line, on a tablet or phone, picks a reason from a short list. Keep the list short, ask for the reason after the stop rather than during the fix, and decide in advance which stop lengths need a reason at all.
Can a camera replace the sensor on a production counter?
At some stations, yes, for example hand-pack tables or bagging stations where a photo eye struggles. In Fabrico, the camera add-on counts output where there is no usable machine signal. Test the count against a hand tally on your own product before you scale it.
How do we compare a counter quote with an OEE software quote?
Send both suppliers one list of lines, count points, screens, sensors, network and training. Then mark which of the 8 checks each offer answers, so you compare what you get and not only the hardware.
Want your own board's gap split into stops, slow running and rejects? Book a demo.
Related articles
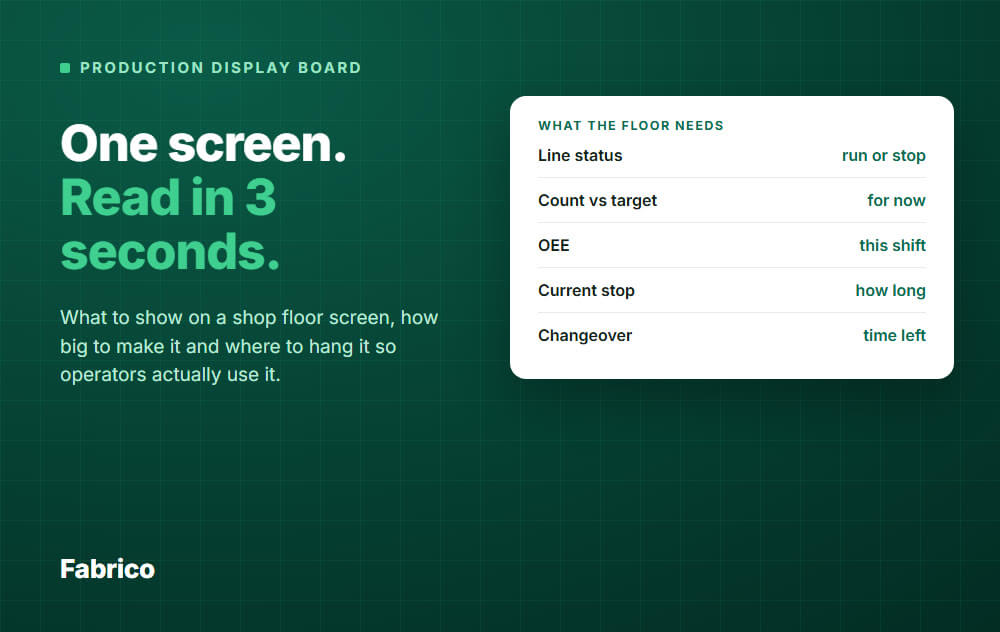





Real Fabrico tiles, sample data.