


 Login
 Blog
SKU Rationalization: The Line Data Behind Cut, Keep or Move

In short: SKU rationalization in a food or FMCG plant needs line evidence beside the revenue and margin view. For each SKU, taken from the plant's own run and changeover logs: the changeover minutes and start-up loss it causes, how often and how long it runs, and the line's OEE while it runs, measured from counts and stops. Set against volume, those figures show what the tail costs in line hours.
- Charge each changeover to the SKU the line changes into, in measured minutes.
- Book start-up rejects as quality, and slow restarts and minor stops as performance.
- Rank SKUs by share of line hours against share of volume.
- Give each tail SKU one call: cut, merge, move, run longer or keep.
Finance comes to the range review with revenue and margin per SKU. Sales brings volume, forecasts and customer commitments. What the pack often lacks is what each SKU costs the line in hours: the subject of this page. Brand, pricing and marketing choices are out of scope here.
Much of a range is variants. The USDA's Economic Research Service reported that food and beverage companies introduced 21,435 new products on U.S. retail shelves in 2016. The count is ten years old, but its definition still fits a range review: it takes in new package sizes, flavors and packaging as well as truly new products. Every SKU that stays on a line adds runs, changeovers and starts to its week.
Fabrico, the publisher of this page, makes OEE software. Every per-SKU figure below comes from your own changeover and run logs, joined to the line's stop and count records. A line system reports OEE by machine, line and shift; the split by SKU is a spreadsheet step.
Why the margin report misses what the line pays
A margin report spreads the line's cost over every case. A tail SKU that runs four times a quarter in short runs, each with a long clean-down and a slow start, carries the same cost per line hour as the core SKU that runs all week. The gap shows only when line time is split by SKU.
Outside food, two university theses show the scale: a 2024 MIT thesis on SKU rationalization at a tractor attachment maker cut roughly 1,000,000 SKU variations to a standard list of 230 offerings that met 75% of modelled 2024 pre-season orders, assuming upselling; a 2012 MIT thesis at a healthcare company expected to release 38% of avoidable costs for one pilot brand, a forecast rather than a measured result.
Packaging adds its own share. A 2023 MIT supply chain capstone on packaging material complexity at a consumer packaged goods maker found that SKUs with a low commonality index, built from components few other SKUs use, had an average total cost 40.8% higher than those with a high one. A merge of near-identical recipes pays twice: fewer changeovers, fewer unique materials.
What the line adds to the SKU rationalization process
For each SKU, from your own run and changeover logs over the same window as the sales data:
- Changeover minutes: measured from the stop record and charged to the SKU the line changes into. Allergen clean-downs and recipe flushes count. The order of runs changes these minutes, which is the subject of SKU changeover sequence optimization; the swap itself is in the changeover checklist.
- Start-up loss: rejects in the first minutes after a start are a quality loss, as startup loss vs reduced yield loss sets out. Slow running and minor stops after a restart count under performance; see reduced speed loss vs minor stops.
- Run frequency and run length: runs in the window and average minutes per run, from the line record checked against the plan.
- Line OEE while each SKU runs: availability, performance and quality from measured run time, counts and rejects in that SKU's run windows, cut from the line's records by the run log in a spreadsheet, against its own rated speed. The arithmetic is in OEE per SKU, and downtime by SKU shows which products stop the line.
Add run time, changeovers and stops and you get line hours per SKU, the figure to set beside volume. What one point of OEE is worth differs by product; valuing output at SKU level covers that side.
Who brings which numbers to the SKU review
Name one owner per figure before the meeting, so nobody rebuilds a number on the day.
| Figure | Brought by | Where it comes from |
|---|---|---|
| Revenue and margin per SKU | Finance | Ledger and cost model |
| Volume, forecast, customer terms | Sales | Orders and contracts |
| Runs, dates, run length | Planning | Plan checked against the line record |
| Changeover and stop minutes | Production or CI | Stop record with causes |
| Start-up rejects, shelf life | Quality | Reject counts, product specs |
| Other line or co-packer capacity | Supply chain | Line trials, co-packer offers |
Worked example: an SKU rationalization analysis on a jar line
Sample figures for illustration only. A sauce plant fills 24 SKUs into the same 500 g jar on one line. The filler limits the line at 100 jars a minute for every SKU, because the jar does not change. The review covers one quarter: 13 weeks of two 8-hour shifts, five days a week, so 1,040 planned hours (62,400 minutes). By volume the SKUs fall into 6 core, 8 middle and 10 tail.
| Group | Planned min | Runs, changeover | A x P x Q | Good jars | OEE |
|---|---|---|---|---|---|
| Core, 6 SKUs | 40,855 | 78 runs, 2,730 min | 86.0% x 92.0% x 99.0% | 3,198,750 | 78.3% |
| Middle, 8 SKUs | 13,495 | 48 runs, 1,920 min | 77.8% x 88.0% x 98.5% | 910,120 | 67.4% |
| Tail, 10 SKUs | 8,050 | 40 runs, 2,400 min | 59.0% x 78.0% x 96.0% | 355,680 | 44.2% |
| Whole line | 62,400 | 166 runs, 7,050 min | 80.7% x 89.8% x 98.7% | 4,464,550 | 71.5% |
Each group's OEE is good jars / (planned minutes x 100): core 3,198,750 / (40,855 x 100) = 78.3%. The factors are rounded to one decimal, so multiplying them back can miss a group's good jars by up to about 1,400.
The tail, step by step:
- Availability: 8,050 planned minutes, of which 2,400 are changeovers and 900 other stops, leave 4,750 minutes of run time: 59.0%.
- Performance: 370,500 jars against 4,750 x 100 = 475,000 possible: 78.0%. Minor stops at the labeller after each label change sit here.
- Quality: 14,820 rejects, most in the first minutes after a start, leave 355,680 good jars: 96.0%.
- Whole line check: 4,464,550 good jars / (62,400 x 100) = 71.5%.
The tail makes 8.0% of the good jars but takes 12.9% of line hours (134.2 of 1,040) and 34.0% of the changeover minutes.
After the review, sales, finance and the line agree three moves for the 10 tail SKUs:
- 4 SKUs leave this line; sales and finance decide which are delisted and which go to a co-packer. 16 runs go.
- 3 near-identical recipes merge into one SKU: 12 runs become 4.
- 3 run half as often at twice the length, which their shelf life allows: 12 runs become 6.
The tail is now 4 SKUs with 10 runs: 600 changeover minutes, 3,600 run minutes and 690 minutes of other stops, so 4,890 planned minutes instead of 8,050. The 4 SKUs that left took 1,150 run minutes and 210 minutes of other stops; their 1,150 x 100 x 78.0% x 96.0% = 86,112 good jars leave with them. Performance and quality are held at the old tail values, which understates the gain from fewer starts. Its own OEE rises to 73.6% x 78.0% x 96.0% = 55.1%.
| Measure | Before | After |
|---|---|---|
| SKUs on the line | 24 | 18 |
| Runs in the quarter | 166 | 136 |
| Changeover minutes | 7,050 | 5,250 |
| Planned hours | 1,040.0 | 987.3 |
| Line A x P x Q | 80.7% x 89.8% x 98.7% | 83.1% x 90.1% x 98.7% |
| Line OEE | 71.5% | 73.9% |
| Good jars per planned hour | 4,293 | 4,435 |
Check: 4,378,438 good jars / (59,240 x 100) = 73.9%. The review frees 52.7 line hours a quarter, about six and a half 8-hour shifts, and the line makes 86,112 fewer good jars (1.9%), the volume of the 4 SKUs that left.
Read the 2.4 point rise with care. Most of it is mix: the line stops running its weakest hours while core and middle SKUs run exactly as before. The figures that count are the hours freed, good jars per planned hour, and what the hours go to: more core volume, one shift fewer, or room for a new SKU. That choice belongs to sales and finance.
In money, with sourced rates. The sample sells a jar at EUR 1.20 ex works, a sample price. The margin comes from a sourced range: the NYU Stern margin dataset by industry (Aswath Damodaran, January 2026 data, 78 US food processing firms) shows a gross margin of 23.23% and a pre-tax operating margin of 10.63%. Gross margin still carries fixed plant costs, so it understates what one more jar adds: EUR 1.20 x 23.23% = about EUR 0.279 a jar.
- If sales can place more core jars: at the core group's 78.3% OEE, the 52.7 freed hours make 52.7 x 60 x 100 x 78.3% = 247,585 jars a quarter, EUR 69,076 of contribution, about EUR 276,305 a year.
- If not, the hours come off the shift plan: a sample crew of 6 at the euro-area industry labour cost of EUR 40.3 an hour from Eurostat hourly labour costs (2025) is EUR 241.80 a line hour; a sample 150 kW line at the EU non-household electricity price of EUR 0.1800 per kWh in the first half of 2026 (Eurostat, medium users) adds EUR 27.00. At EUR 268.80 a line hour, 52.7 hours are EUR 14,165.76 a quarter, about EUR 56,663 a year, if the shift can really be dropped, for example overtime or agency hours.
Either figure goes beside what the 86,112 jars that left were worth: EUR 24,025 a quarter at the same EUR 0.279.
If the routing standard says 60 minutes but the stop record shows 80, a review run on the standard misses 20 minutes on each of the 30 changeovers it removes: 10 hours. The real gain is 62.7 line hours, not 52.7, and the standard would have understated the tail.
Want to see a connected line's changeover log, with minutes by cause and shift? Book a demo.
Cut, keep, merge or move: the decision table
Price the cheaper move before any SKU goes. A UK chilled ready-meal maker with a portfolio of 70+ products (Garcia-Garcia, Singh and Jagtap, Sustainability, 2022) cut changeover from 29 to 20 minutes with SMED, and a food processor whose wide range meant frequent, lengthy changeovers (Maalouf and Zaduminska, 2019) cut changeover time by 34% and raised its main line's capacity by 11%. A 30% cut on the sample tail takes its 2,400 changeover minutes to 1,680: 12 line hours a quarter back without losing a SKU.
| Line evidence | Commercial view | Call |
|---|---|---|
| Large share of changeover minutes, low OEE while running | No customer or margin reason to keep | Cut or delist |
| Recipe and pack nearly the same as a core SKU | Customers accept the core spec | Merge into one SKU |
| Slow at this line's limiting machine; another line suits the format | Volume worth keeping | Move to the other line |
| Short, rare runs that crowd the plan | Needed, but low volume | Move to a co-packer |
| Short runs, steady demand | Shelf life allows more stock | Longer, rarer runs |
| Poor OEE while running | A key customer needs it | Keep, fix its top loss first |
| Good OEE, few changeovers | Any | Keep |
The seven calls come down to four options. What each costs, in sample figures from the jar line, priced with the sourced margin, labour and power rates above:
| Option | Cost or effort (sample) | Choose it if |
|---|---|---|
| Cut or delist | The contribution of the jars that leave: 86,112 jars, EUR 24,025 a quarter; plus customer notice and running down stock | The SKU takes a large share of changeover minutes and no customer or margin reason keeps it |
| Merge into a core recipe | One trial shift with a crew of 5: 40 hours x EUR 40.3 = EUR 1,612.00, plus label and spec changes; in the sample, 8 fewer runs and 480 changeover minutes a quarter | Recipe and pack are nearly the same as a core SKU and customers accept the core spec |
| Move to another line or a co-packer | A new rated speed and changeover family to measure at the new home; at a co-packer, its premium over your own variable cost | Volume is worth keeping but the SKU is slow at this line's limiting machine, or its short runs crowd the plan |
| Keep, with longer runs or a faster changeover | Stock for longer runs, within shelf life; or a SMED team of 3 for three 8 hour days, 72 hours x EUR 40.3 = EUR 2,901.60, for 12 tail line hours a quarter back, EUR 3,225.60 at EUR 268.80 a line hour | A key customer needs it, demand is steady, or one loss explains most of its poor OEE |
Questions to put to vendors and your own team
- Sales: which tail SKUs carry a contract or listing terms, and what notice does a delisting need?
- Finance: which contribution per jar do we use, and does it sit near the food processing margin range?
- Quality: which recipes can merge without a label or allergen change, and what shelf life caps longer runs?
- Co-packer: what does it charge per unit for a short-run SKU, and how will it report output and rejects?
- Your OEE or MES software vendor: can stop minutes with cause and timestamps be exported, so they split by the run log SKU by SKU?
- Planning: which other line could take a moved SKU, and at what rated speed?
A moved SKU gets a new rated speed and a new changeover family, so measure it at its new home for a few weeks before the review closes. For a move to a co-packer, agree how its performance will be reported; OEE in co-packing agreements lists the clauses.
Where SKU reviews go wrong, and the early sign
| What goes wrong | Early sign in the data | Fix |
|---|---|---|
| Changeover minutes averaged over all SKUs | Every SKU shows about the same minutes per change | Use each change's own minutes from the stop record |
| Runs taken from the plan | Run counts differ from the stop record; short extra runs missing | Rebuild the run log from line start and end times |
| One monthly OEE figure used for every SKU | All SKUs within a point of the line average | Split shift records by the run log's start and end times |
| Longer runs on a short-life SKU | Write-offs near the date | Check the cap; after the "use by" date a food shall be deemed to be unsafe (EU 1169/2011, Art. 24, UK text) |
| Freed hours never used | Planned hours unchanged next quarter | Decide their use in the review itself |
SKU rationalization checklist for the line team
Paste these into the review pack; the owners are in the table above.
- One window for every SKU: The same 13 weeks, or other window, as the sales and margin data?
- Run log per SKU: Runs, run lengths and dates taken from the line record, not from the plan alone?
- Changeover minutes, measured: Taken from the stop record, not a routing standard?
- Start-up loss per start: Slow minutes and rejects after each start counted, and kept apart from the run itself?
- Line OEE while it runs: Availability, performance and quality from counts and stops, not the routing rate?
- Line hours against volume: Each SKU's share of line hours set beside its share of good units?
- Every option tested: Cut, merge, move or longer runs considered, with shelf life and customer terms checked?
- Re-measured afterwards: Same window length and counting point after the change, to see if the hours came free?
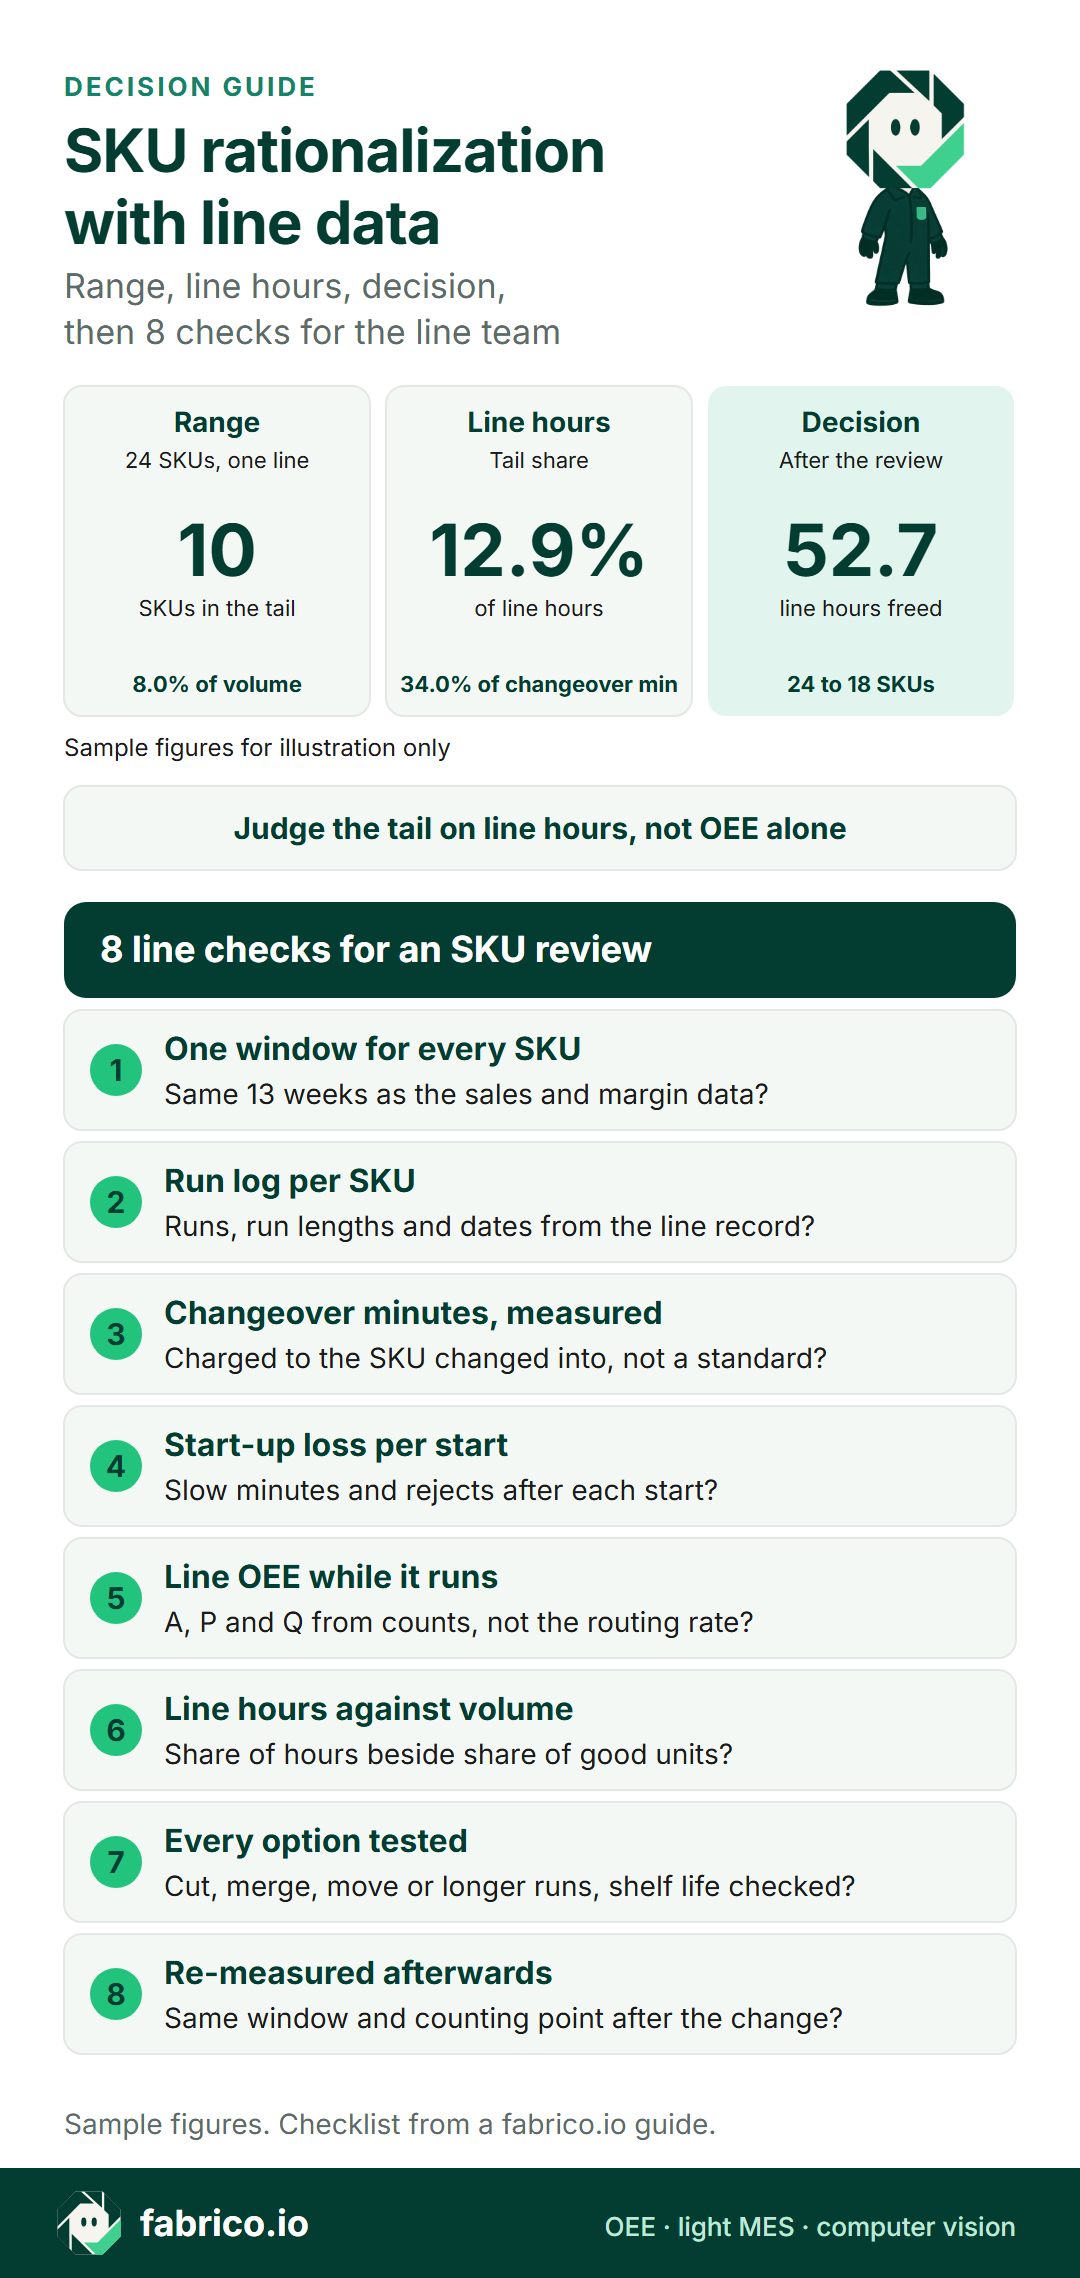
Text version of this infographic
- Title: SKU rationalization with line data.
- Sample figures for illustration only.
- Range: 24 SKUs on one line, 10 of them in the tail, making 8.0% of the volume.
- Line hours: the tail takes 12.9% of line hours and 34.0% of changeover minutes.
- Decision: after the review, 52.7 line hours are freed and the range goes from 24 to 18 SKUs.
- Judge the tail on line hours, not OEE alone.
- 8 checks: one window for every SKU, run log per SKU, changeover minutes measured, start-up loss per start, line OEE while it runs, line hours against volume, every option tested, re-measured afterwards.
Before the next range review: this week and this quarter
Every SKU figure in this method comes from your own changeover and run logs, joined to the line's records. A line system such as Fabrico reports OEE by machine, line and shift; the split by SKU is a spreadsheet step on your run log.
This week
- Export last quarter's stop records, with cause and minutes, and the line's shift figures.
- Get the run log from planning, SKU with start and end of every run, and check it against the stop record.
- Join the two in a spreadsheet: for each run window, sum run time, stops, counts and rejects, plus the changeover that opens it.
This quarter
- Rank SKUs by share of line hours against share of good units, and group them into core, middle and tail.
- Agree a call for each tail SKU with sales and finance, cheaper changeovers first.
- Re-measure over the same window length and report hours freed and good units per planned hour.
What Fabrico records for an SKU review
Fabrico, OEE and light MES software, supplies the line half of the evidence: stops with their causes, counts, and availability, performance and quality for each line and shift, measured from the machine signal. Which SKUs stay is a commercial decision.
What you see: a shift timeline, unclassified time waiting for a reason, and the operator's line-down screen, on sample lines.
Plays from YouTube. Google may set cookies when you press play. Privacy policy.
What it records for the review:
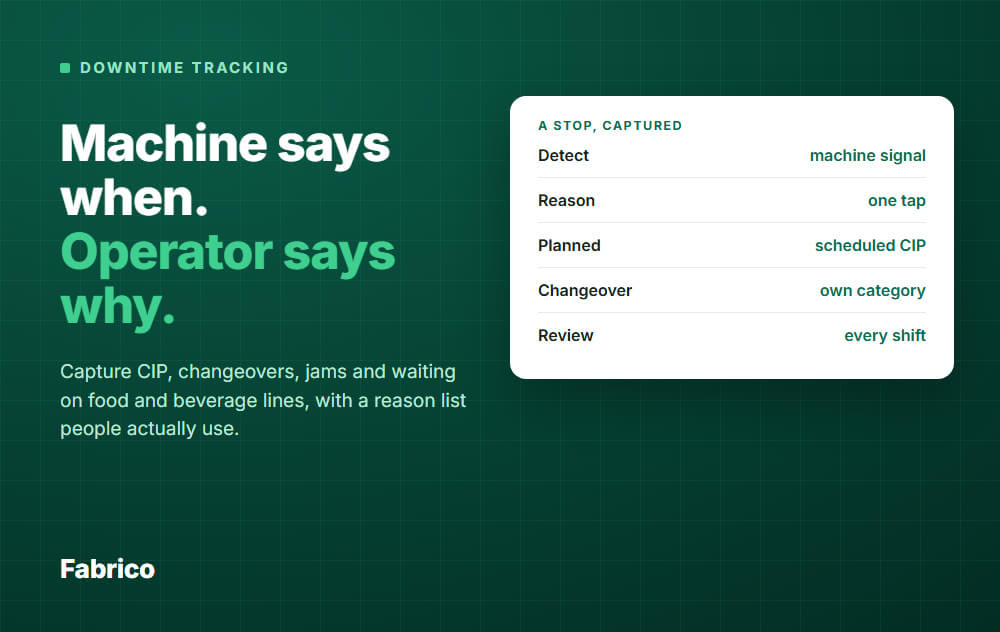
- Changeover minutes with a cause: operators tag why the line stopped on a tablet or phone, and downtime splits by cause, machine and shift for this week or a past period, so changeovers and clean-downs carry measured minutes.
- Three factors from the machine: availability, performance and quality for each line and shift, from the PLC or an IoT device with sensors. Micro-stops are detected from the machine signal and land in performance.
- Losses in money: lost minutes carry a money value, a figure finance can set beside the margin report.
- The SKU split, done in a spreadsheet: any list exports to Excel or CSV, or leaves through the REST API and webhooks, ready to line up against the plan's run log SKU by SKU.
- Hand-packed tail formats: if a tail SKU ends up as a gift pack or multipack put together by hand at a packing table with no machine signal, the camera add-on counts the packs. Video from the camera add-on for a stop minute is streamed on request and not stored in Fabrico. On the roadmap: the camera add-on proposing a likely stop reason for the operator to confirm.
Production planning and scheduling are not part of Fabrico today. Further reading:
- For what to look for in a system, see choosing OEE software.
- For how far a light system goes, see light MES explained; the product is on the OEE and MES overview and the camera add-on page.
- For plant types, see computer vision for FMCG manufacturing, MES in mid-size FMCG plants or MES for food manufacturing.
Questions from SKU range reviews
What is SKU rationalization?
A review of a product range that decides which SKUs to cut, merge, move or keep. In a food or FMCG plant, sales and finance bring revenue, margin and customer terms; the line brings changeover minutes, start-up loss, run length and OEE while each SKU runs, all taken from the plant's own run and changeover logs.
What production data does an SKU rationalization analysis need?
From the plant's own run and changeover logs, for one window such as a quarter and for each SKU: runs and run length, measured changeover minutes, rejects and slow minutes after each start, and availability, performance and quality while it runs. Run time plus changeovers plus stops gives line hours per SKU.
Which SKU should a changeover be charged to?
To the SKU the line changes into, in measured minutes, with clean-downs and allergen changeovers included. The run order changes those minutes, so check the sequence before blaming one SKU.
Why does line OEE rise after tail SKUs are cut?
Mostly mix: the line stops running its weakest hours while the rest runs as before. In the sample, OEE rose from 71.5% to 73.9% with no change to the core SKUs. Judge the change on line hours freed and good units per planned hour.
When should a tail SKU go to a co-packer instead of being cut?
When customers still need it, its volume is worth keeping and it suits the co-packer's line better. Agree the performance terms before the first run; OEE in co-packing agreements lists them.
How long a window should an SKU review cover?
Long enough for each tail SKU to run several times, and the same window as the sales and margin data. In the sample, one quarter gives each tail SKU four runs.
Want to see how a connected line records changeover minutes by cause, and line OEE by shift split into availability, performance and quality? Book a demo.
Related articles
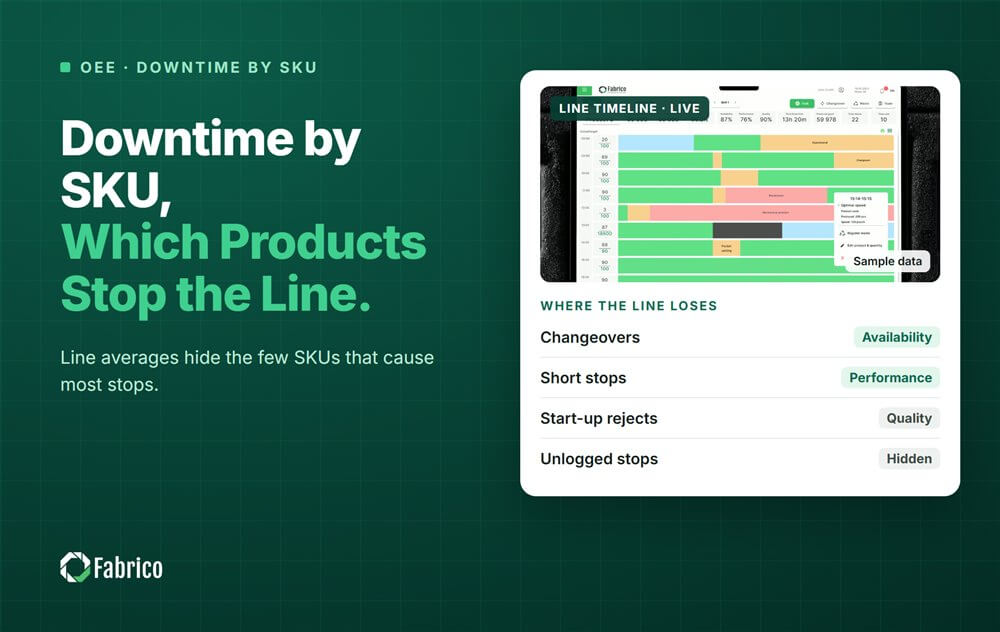
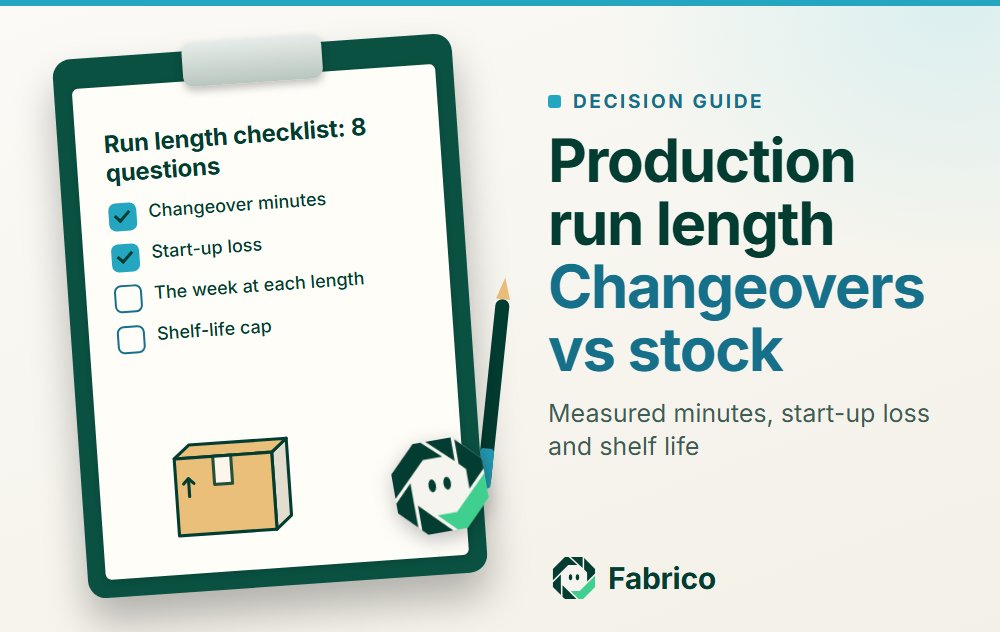









Real Fabrico tiles, sample data.